
- Home >
- Stock Photos >
- Interactive Data Visualization in Modern Business Analytics
Interactive Data Visualization in Modern Business Analytics Image
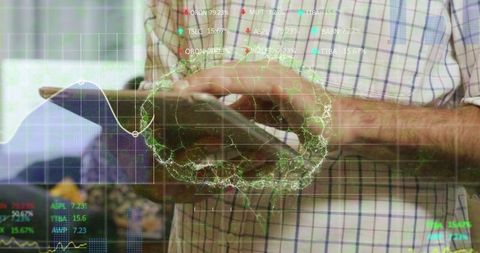
A man in a checkered shirt is actively using a tablet, with overlaid images of a wireframe brain, stock tickers, and data graphs. This combination creates a modern concept of business analytics and data-driven decision-making facilitated by technology. Ideal for showcasing the fusion of human intellect with digital tools, as well as illustrating concepts in financial analytics, innovation, and tech-savvy business environments.
Powered by  - Get 15% off with code: PIKWIZARD15


downloads
Tags:
More
Credit Photo
If you would like to credit the Photo, here are some ways you can do so
Text Link
photo Link
<span class="text-link">
<span>
<a target="_blank" href=https://pikwizard.com/photo/interactive-data-visualization-in-modern-business-analytics/2da139f9e857b1db4319df870a33e5b5/>PikWizard</a>
</span>
</span>
<span class="image-link">
<span
style="margin: 0 0 20px 0; display: inline-block; vertical-align: middle; width: 100%;"
>
<a
target="_blank"
href="https://pikwizard.com/photo/interactive-data-visualization-in-modern-business-analytics/2da139f9e857b1db4319df870a33e5b5/"
style="text-decoration: none; font-size: 10px; margin: 0;"
>
<img src="https://pikwizard.com/pw/medium/2da139f9e857b1db4319df870a33e5b5.jpg" style="margin: 0; width: 100%;" alt="" />
<p style="font-size: 12px; margin: 0;">PikWizard</p>
</a>
</span>
</span>
Free (free of charge)
Free for personal and commercial use.
Author: Awesome Content
Similar Free Stock Images

Premium


Premium


Premium

Premium

Premium

Premium


Premium


Premium


Premium

Premium


Premium


Premium


Premium


Premium


Premium

Premium

Premium


Premium

Premium


Premium


Premium


Premium


Premium


Premium


Premium


Explore More Free Stock Images