- Home >
- Stock Photos >
- Interactive Data Visualization with Graphs and Metrics Interface
Interactive Data Visualization with Graphs and Metrics Interface Image
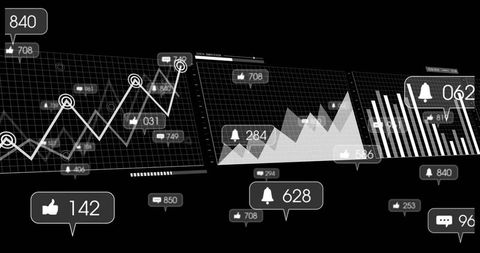
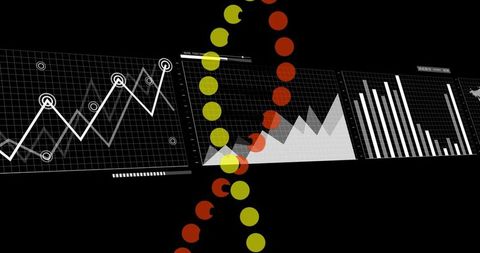
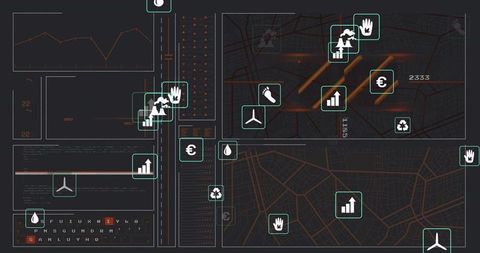
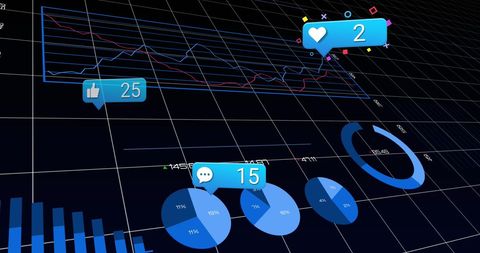
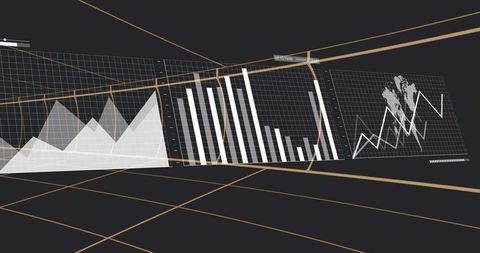
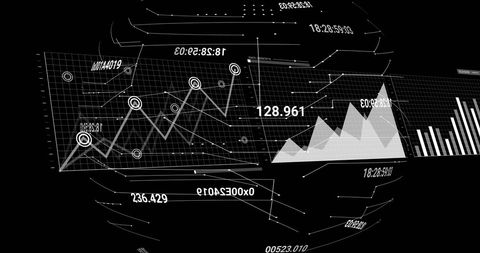
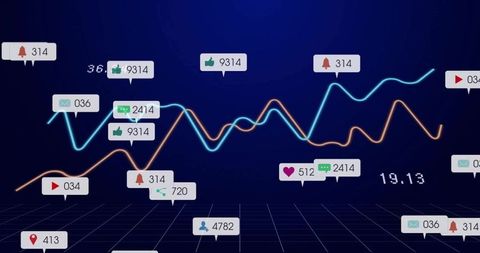
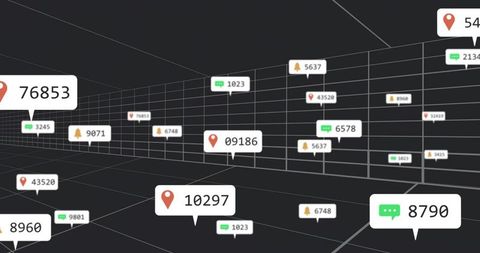
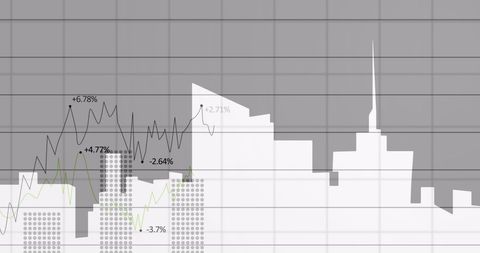
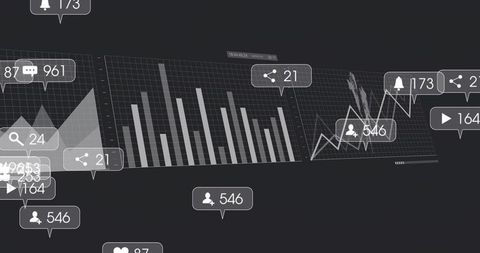
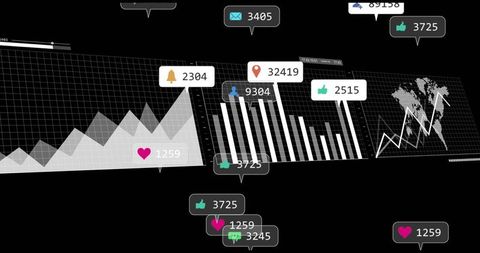
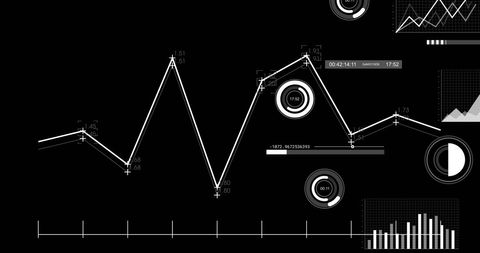
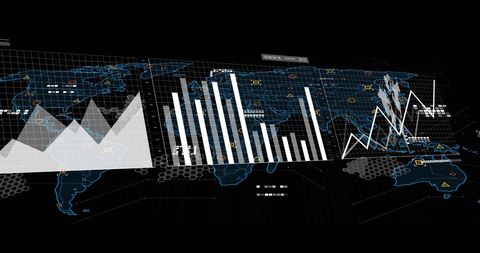
Digital representation of an analytics dashboard illustrating various charts like line and bar graphs along with interactive notifications and metrics. Useful for presentations on data analysis, business strategies, technology applications, or educational purposes to demonstrate insights and trends. Ideal for use in media, advertising, blogs, or articles focused on data-driven decision-making.

downloads
Tags:
More
Credit Photo
If you would like to credit the Photo, here are some ways you can do so
Text Link
photo Link
<span class="text-link">
<span>
<a target="_blank" href=https://pikwizard.com/photo/interactive-data-visualization-with-graphs-and-metrics-interface/5efcc8acf45e795555ba5d44c221f70a/>PikWizard</a>
</span>
</span>
<span class="image-link">
<span
style="margin: 0 0 20px 0; display: inline-block; vertical-align: middle; width: 100%;"
>
<a
target="_blank"
href="https://pikwizard.com/photo/interactive-data-visualization-with-graphs-and-metrics-interface/5efcc8acf45e795555ba5d44c221f70a/"
style="text-decoration: none; font-size: 10px; margin: 0;"
>
<img src="https://pikwizard.com/pw/medium/5efcc8acf45e795555ba5d44c221f70a.jpg" style="margin: 0; width: 100%;" alt="" />
<p style="font-size: 12px; margin: 0;">PikWizard</p>
</a>
</span>
</span>
Free (free of charge)
Free for personal and commercial use.
Author: Creative Art