
- Home >
- Stock Photos >
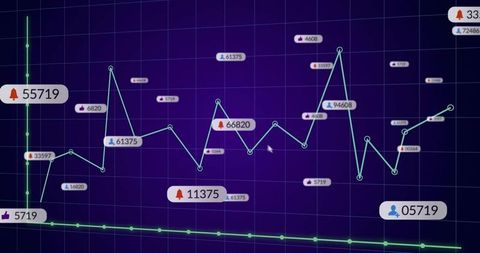
- Interactive Digital Analytics Dashboard with Engagement Data
Interactive Digital Analytics Dashboard with Engagement Data Image

Shows a purple-themed analytical graph with interactive elements representing different digital engagement metrics like likes, views, messages, and notifications. Useful for social media analysis, digital marketing presentations, or articles on tech analytics.
Powered by 


downloads
Tags:
More
Credit Photo
If you would like to credit the Photo, here are some ways you can do so
Text Link
photo Link
<span class="text-link">
<span>
<a target="_blank" href=https://pikwizard.com/photo/interactive-digital-analytics-dashboard-with-engagement-data/4c3e6d5c78d9a75850c7ca3f097712c0/>PikWizard</a>
</span>
</span>
<span class="image-link">
<span
style="margin: 0 0 20px 0; display: inline-block; vertical-align: middle; width: 100%;"
>
<a
target="_blank"
href="https://pikwizard.com/photo/interactive-digital-analytics-dashboard-with-engagement-data/4c3e6d5c78d9a75850c7ca3f097712c0/"
style="text-decoration: none; font-size: 10px; margin: 0;"
>
<img src="https://pikwizard.com/pw/medium/4c3e6d5c78d9a75850c7ca3f097712c0.jpg" style="margin: 0; width: 100%;" alt="" />
<p style="font-size: 12px; margin: 0;">PikWizard</p>
</a>
</span>
</span>
Free (free of charge)
Free for personal and commercial use.
Author: Authentic Images
Similar Free Stock Images

Premium


Premium


Premium


Premium


Premium


Premium


Premium


Premium


Premium

Premium


Premium


Premium


Premium


Premium


Premium


Premium


Premium


Premium


Premium


Premium


Premium


Premium


Premium


Premium

Premium


Explore More Free Stock Images