
- Home >
- Stock Photos >
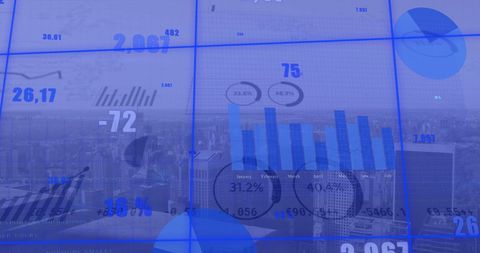
- Interactive Digital Dashboard Displaying Analytics and Social Metrics
Interactive Digital Dashboard Displaying Analytics and Social Metrics Image

Visual depiction of an interactive digital dashboard overlaying data with analytical representations such as bar charts and pie charts. Highlighting connectivity and interaction, social media reaction icons indicate engagement levels, blending technology with business analytics. Ideal for promoting technology services, presentations on data-driven strategies, and digital marketing content.
Powered by  - Get 15% off with code: PIKWIZARD15


downloads
Tags:
More
Credit Photo
If you would like to credit the Photo, here are some ways you can do so
Text Link
photo Link
<span class="text-link">
<span>
<a target="_blank" href=https://pikwizard.com/photo/interactive-digital-dashboard-displaying-analytics-and-social-metrics/536d477ba5a5ff8e8506e20a63130d45/>PikWizard</a>
</span>
</span>
<span class="image-link">
<span
style="margin: 0 0 20px 0; display: inline-block; vertical-align: middle; width: 100%;"
>
<a
target="_blank"
href="https://pikwizard.com/photo/interactive-digital-dashboard-displaying-analytics-and-social-metrics/536d477ba5a5ff8e8506e20a63130d45/"
style="text-decoration: none; font-size: 10px; margin: 0;"
>
<img src="https://pikwizard.com/pw/medium/536d477ba5a5ff8e8506e20a63130d45.jpg" style="margin: 0; width: 100%;" alt="" />
<p style="font-size: 12px; margin: 0;">PikWizard</p>
</a>
</span>
</span>
Free (free of charge)
Free for personal and commercial use.
Author: Awesome Content
Similar Free Stock Images
Loading...

Premium


Premium


Premium


Premium


Premium

Premium


Premium


Premium


Premium


Premium

Premium


Premium


Premium

Premium


Premium


Premium


Premium

Premium

Premium


Premium


Premium


Premium

Premium


Premium


Premium
