- Home >
- Stock Photos >
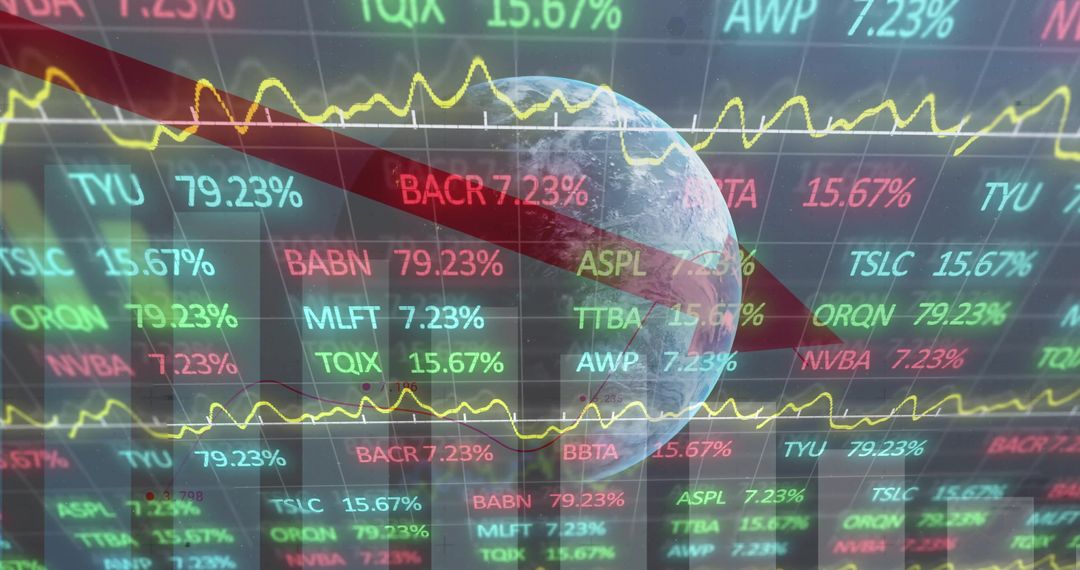
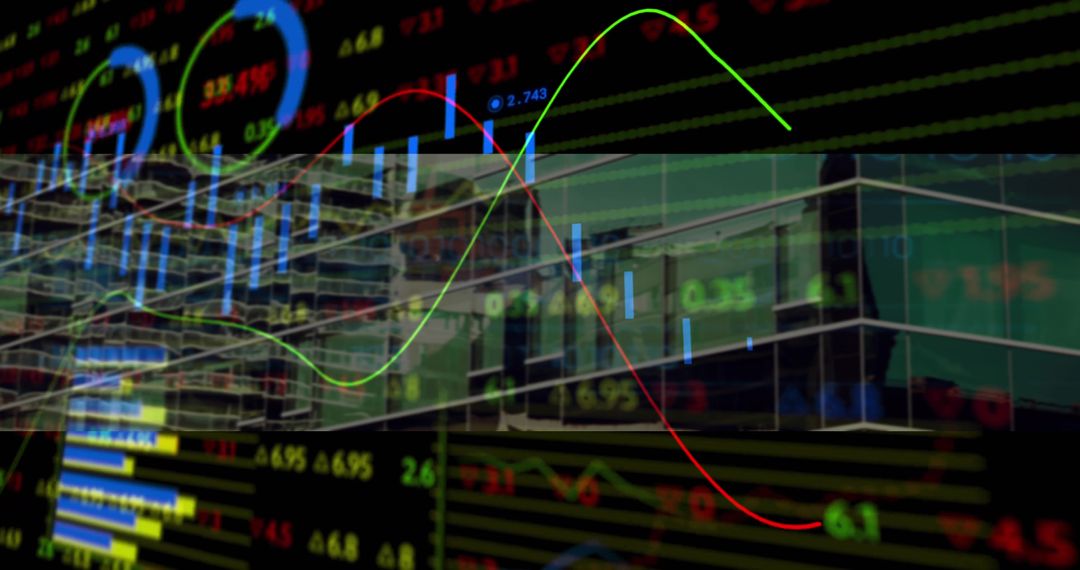
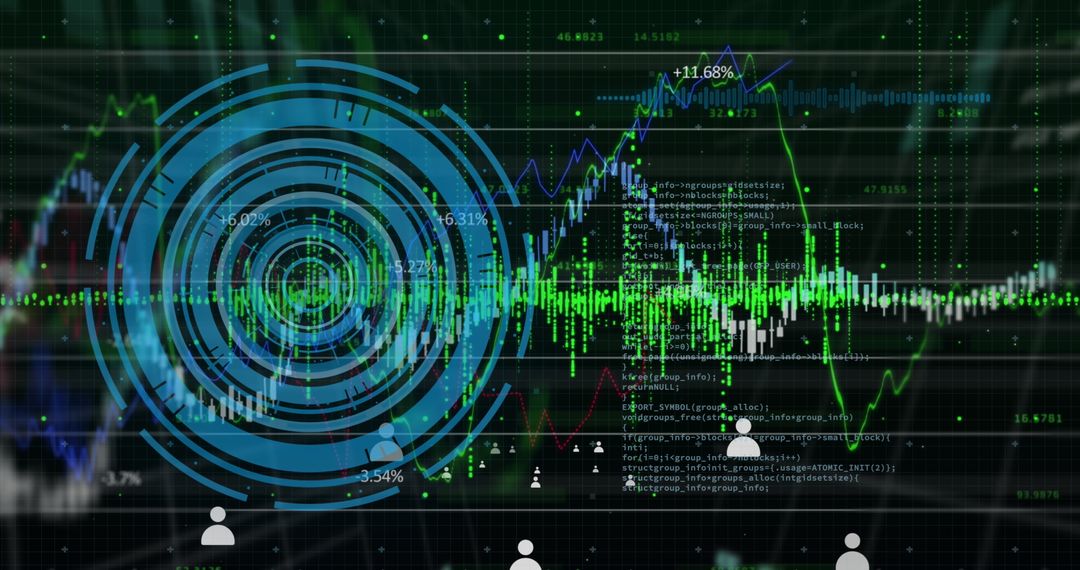
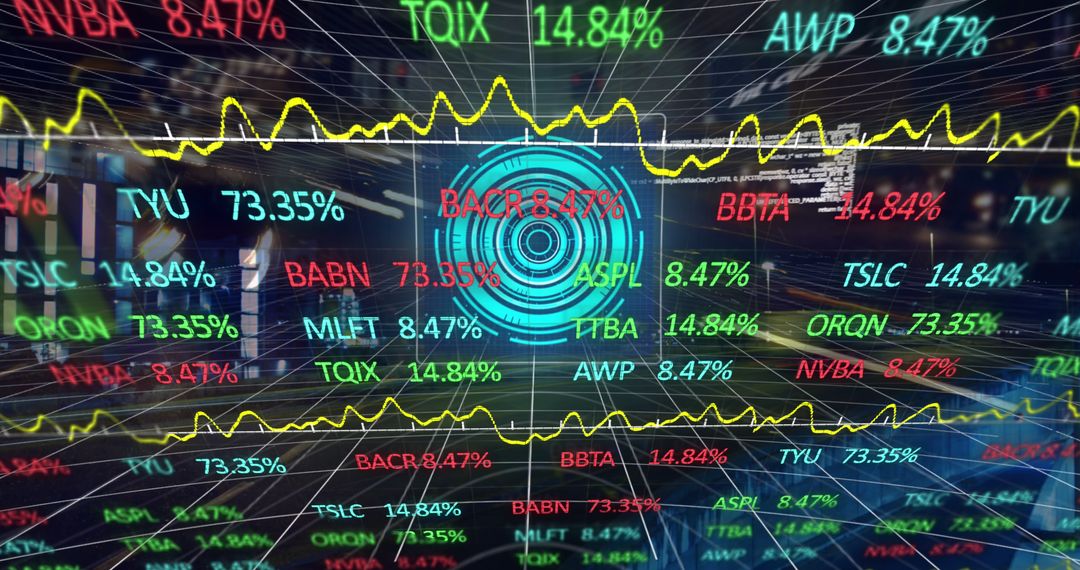
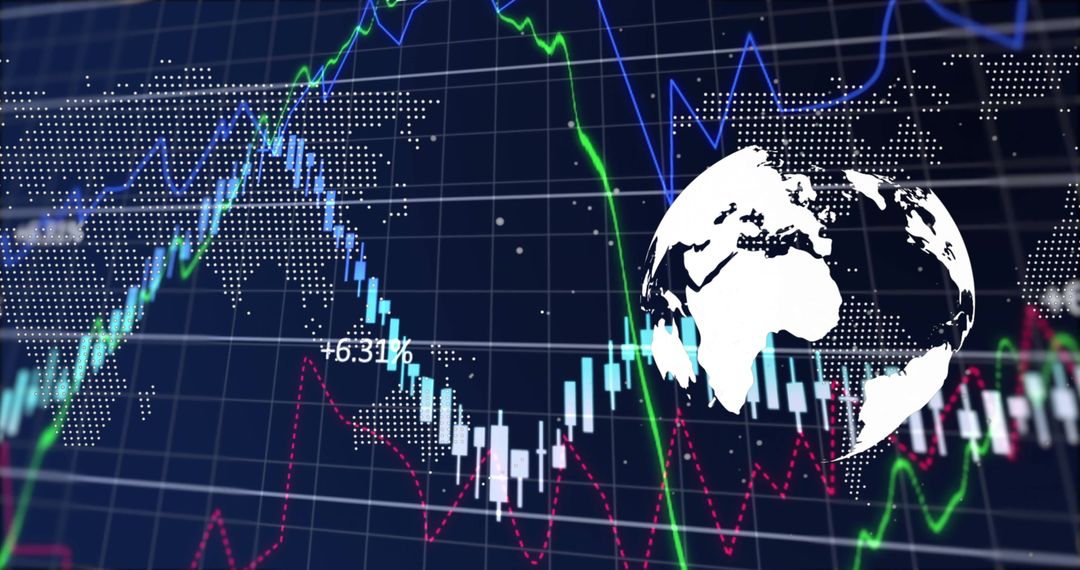
- Interactive Digital Dashboard with Financial Charts and Global Icon
Interactive Digital Dashboard with Financial Charts and Global Icon Image
Innovative digital dashboard displays comprehensive financial data with interactive elements like candlestick charts and line graphs over a vibrant background. Featuring a global icon, this can be used for presentations on financial technology, data analytics, or global market presentations. Ideal for corporate materials, educational content, and financial blogs to illustrate modern investment strategies and technological advancements in data analysis.
Powered by  - Get 15% off with code: PIKWIZARD15


0
downloads
downloads
Tags:
More
Credit Photo
If you would like to credit the Photo, here are some ways you can do so
Text Link
photo Link
<span class="text-link">
<span>
<a target="_blank" href=https://pikwizard.com/photo/interactive-digital-dashboard-with-financial-charts-and-global-icon/364b41c5854fbfc3f73cbfd3f8acad49/>PikWizard</a>
</span>
</span>
<span class="image-link">
<span
style="margin: 0 0 20px 0; display: inline-block; vertical-align: middle; width: 100%;"
>
<a
target="_blank"
href="https://pikwizard.com/photo/interactive-digital-dashboard-with-financial-charts-and-global-icon/364b41c5854fbfc3f73cbfd3f8acad49/"
style="text-decoration: none; font-size: 10px; margin: 0;"
>
<img src="https://pikwizard.com/pw/medium/364b41c5854fbfc3f73cbfd3f8acad49.jpg" style="margin: 0; width: 100%;" alt="" />
<p style="font-size: 12px; margin: 0;">PikWizard</p>
</a>
</span>
</span>
Free (free of charge)
Free for personal and commercial use.
Author: People Creations
Similar Free Stock Images

Premium


Premium


Premium


Premium


Premium


Premium


Premium


Premium


Premium


Premium


Premium


Premium


Premium


Premium


Premium


Premium


Premium


Premium


Premium


Premium


Premium


Premium


Premium


Premium