
- Home >
- Stock Photos >
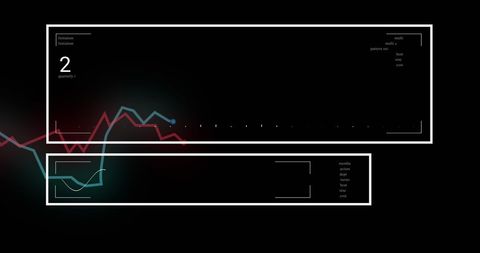
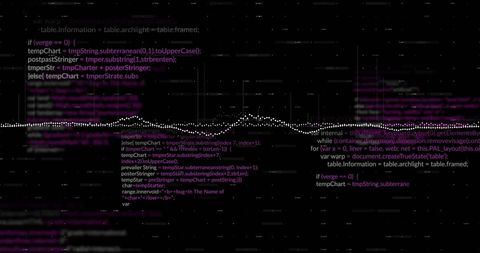
- Interactive Digital Waveform with Floating Play, Like, Subscribe UI
Interactive Digital Waveform with Floating Play, Like, Subscribe UI Image
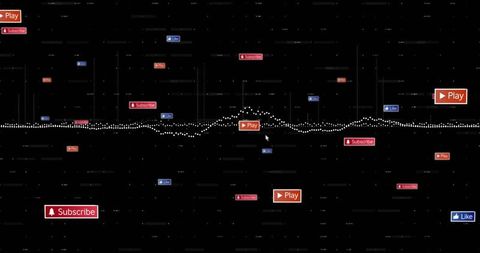
Digital waveform displayed across a vivid black background with floating red Play, Subscribe, and blue Like buttons provides visualization of interactive digital concepts. Ideal for illustrating modern multimedia, user engagement, and technology interfaces, this visual can be used in presentations about digital audio strategies, UI/UX design, or technological advancements. Suitable for creators discussing subscriber growth and interaction with digital platforms.
Powered by 


downloads
Tags:
More
Credit Photo
If you would like to credit the Photo, here are some ways you can do so
Text Link
photo Link
<span class="text-link">
<span>
<a target="_blank" href=https://pikwizard.com/photo/interactive-digital-waveform-with-floating-play-like-subscribe-ui/fe7c1bed1f97cc8bcfc804d3c8d6ed35/>PikWizard</a>
</span>
</span>
<span class="image-link">
<span
style="margin: 0 0 20px 0; display: inline-block; vertical-align: middle; width: 100%;"
>
<a
target="_blank"
href="https://pikwizard.com/photo/interactive-digital-waveform-with-floating-play-like-subscribe-ui/fe7c1bed1f97cc8bcfc804d3c8d6ed35/"
style="text-decoration: none; font-size: 10px; margin: 0;"
>
<img src="https://pikwizard.com/pw/medium/fe7c1bed1f97cc8bcfc804d3c8d6ed35.jpg" style="margin: 0; width: 100%;" alt="" />
<p style="font-size: 12px; margin: 0;">PikWizard</p>
</a>
</span>
</span>
Free (free of charge)
Free for personal and commercial use.
Author: People Creations
Similar Free Stock Images

Premium


Premium


Premium


Explore More Free Stock Images