
- Home >
- Stock Photos >
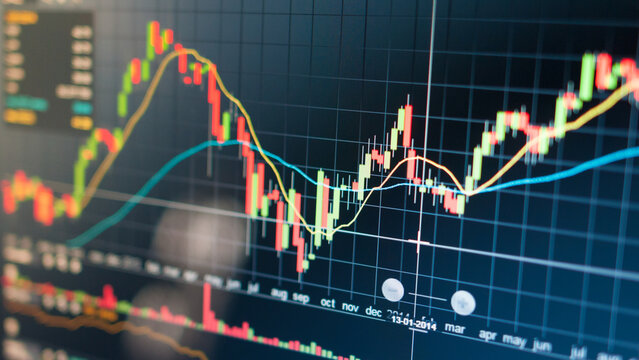
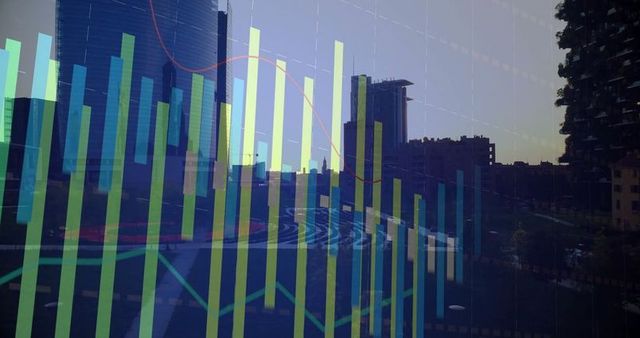
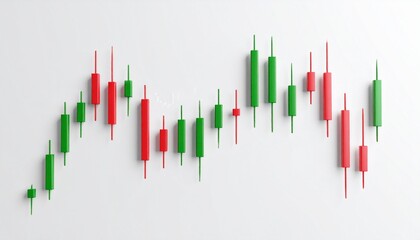
- Interactive Financial Chart with Dynamic Data and Trends
Interactive Financial Chart with Dynamic Data and Trends Image

Digital visualization featuring stock bars and candlestick patterns overlaid with dynamic trend lines and data labels in a grid composition. Perfect for use in financial markets analysis presentations, economic reports, investment strategy documents, technology-centered graphics, or educational materials on data visualization techniques.
Powered by 


downloads
Tags:
More
Credit Photo
If you would like to credit the Photo, here are some ways you can do so
Text Link
photo Link
<span class="text-link">
<span>
<a target="_blank" href=https://pikwizard.com/photo/interactive-financial-chart-with-dynamic-data-and-trends/913370adbc96acd4f40b89da2e2777c7/>PikWizard</a>
</span>
</span>
<span class="image-link">
<span
style="margin: 0 0 20px 0; display: inline-block; vertical-align: middle; width: 100%;"
>
<a
target="_blank"
href="https://pikwizard.com/photo/interactive-financial-chart-with-dynamic-data-and-trends/913370adbc96acd4f40b89da2e2777c7/"
style="text-decoration: none; font-size: 10px; margin: 0;"
>
<img src="https://pikwizard.com/pw/medium/913370adbc96acd4f40b89da2e2777c7.jpg" style="margin: 0; width: 100%;" alt="" />
<p style="font-size: 12px; margin: 0;">PikWizard</p>
</a>
</span>
</span>
Free (free of charge)
Free for personal and commercial use.
Author: Awesome Content
Similar Free Stock Images

Premium


Premium

Premium


Premium


Premium

Premium


Premium


Premium


Premium

Premium


Premium


Premium


Premium


Premium

Premium


Premium


Premium

Premium

Premium


Premium


Premium


Premium


Premium


Premium


Premium

Explore More Free Stock Images