- Home >
- Stock Photos >
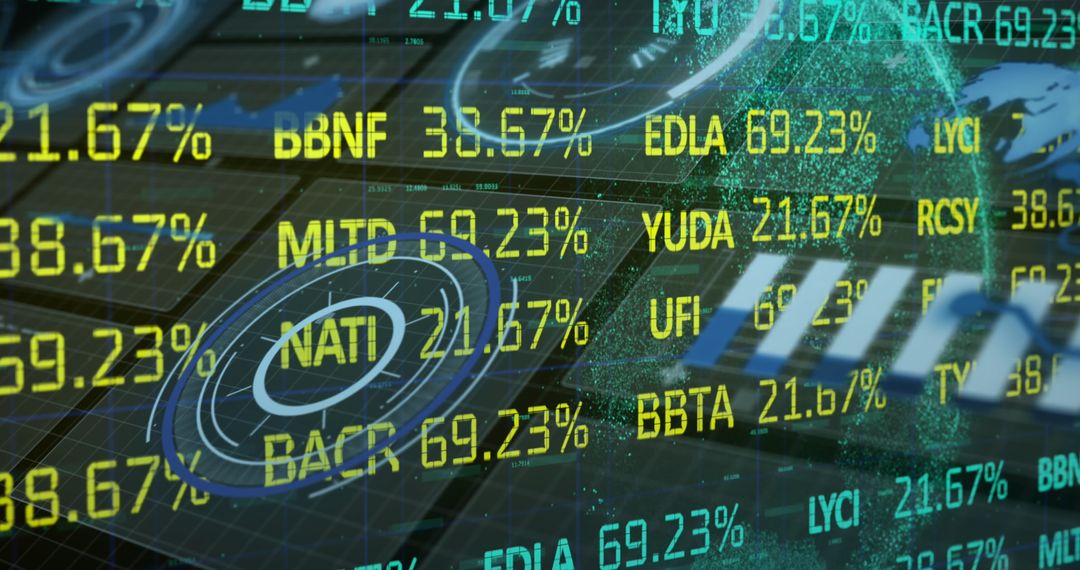
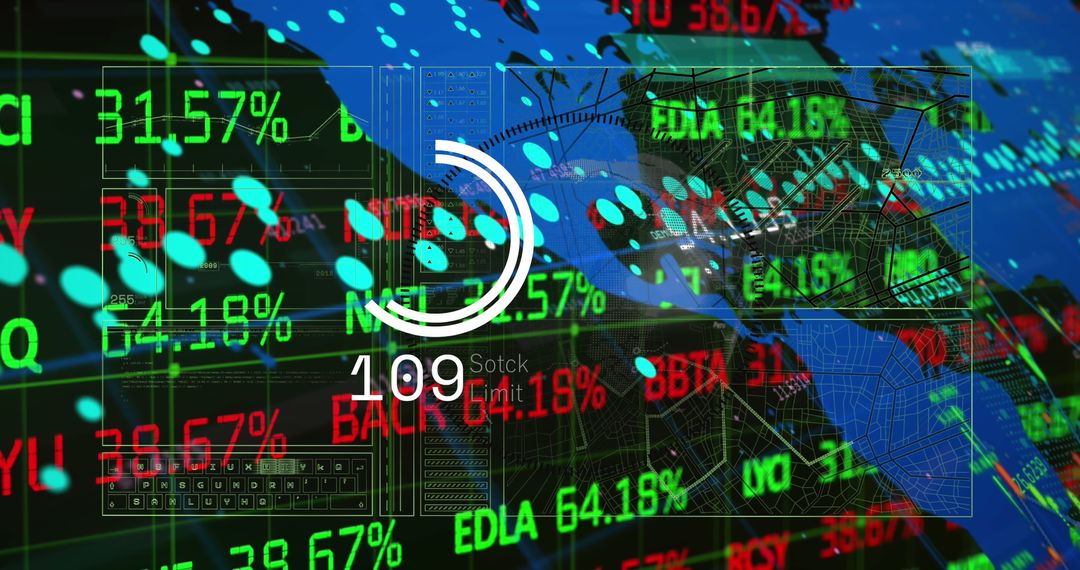
- Interactive Financial Dashboard with Data Analytics and Ticker Overlay
Interactive Financial Dashboard with Data Analytics and Ticker Overlay Image

This image displays a digital gauge integrated into a financial dashboard overlay of market tickers. Ideal for illustrating concepts of advanced data analytics in finance, the use of technology in investment management, or contemporary financial tools. Suitable for presentations on financial data analysis, educational materials for financial literacy, and resources for demonstrating market trends and evaluation techniques.
Powered by  - Get 15% off with code: PIKWIZARD15


2
downloads
downloads
Tags:
More
Credit Photo
If you would like to credit the Photo, here are some ways you can do so
Text Link
photo Link
<span class="text-link">
<span>
<a target="_blank" href=https://pikwizard.com/photo/interactive-financial-dashboard-with-data-analytics-and-ticker-overlay/6b4c160536acfa03c50ac97ec1a36f83/>PikWizard</a>
</span>
</span>
<span class="image-link">
<span
style="margin: 0 0 20px 0; display: inline-block; vertical-align: middle; width: 100%;"
>
<a
target="_blank"
href="https://pikwizard.com/photo/interactive-financial-dashboard-with-data-analytics-and-ticker-overlay/6b4c160536acfa03c50ac97ec1a36f83/"
style="text-decoration: none; font-size: 10px; margin: 0;"
>
<img src="https://pikwizard.com/pw/medium/6b4c160536acfa03c50ac97ec1a36f83.jpg" style="margin: 0; width: 100%;" alt="" />
<p style="font-size: 12px; margin: 0;">PikWizard</p>
</a>
</span>
</span>
Free (free of charge)
Free for personal and commercial use.
Author: Awesome Content
Similar Free Stock Images

Premium


Premium


Premium


Premium


Premium


Premium


Premium


Premium


Premium


Premium


Premium


Premium


Premium


Premium


Premium


Premium


Premium


Premium


Premium


Premium


Premium


Premium


Premium


Premium