
- Home >
- Stock Photos >
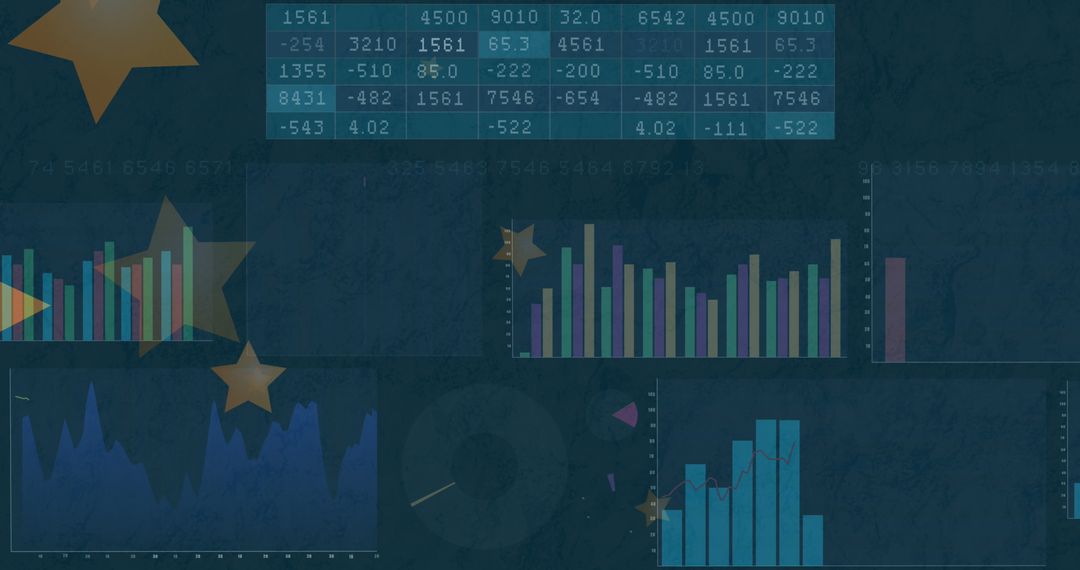
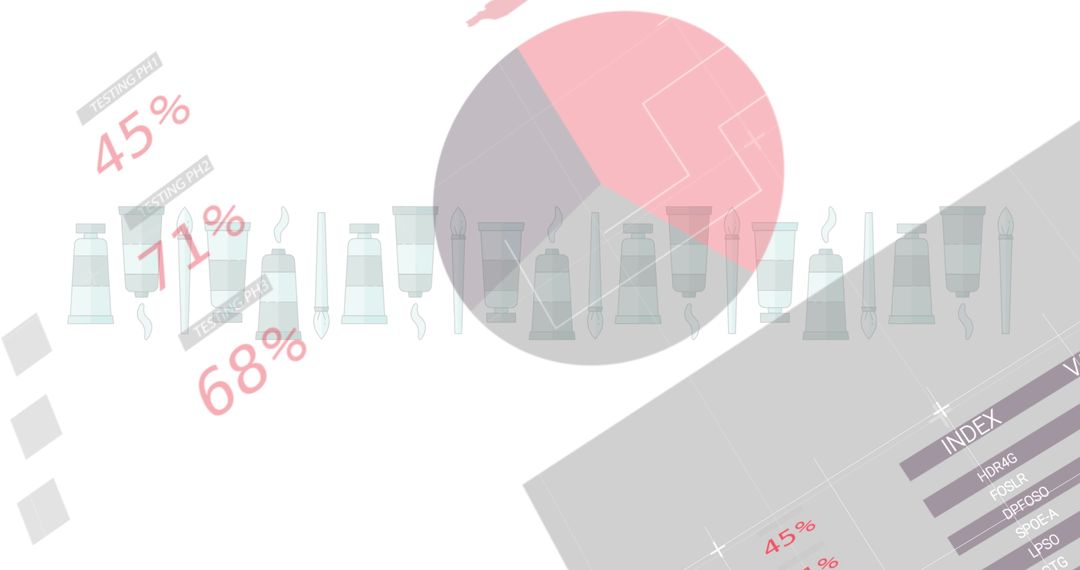
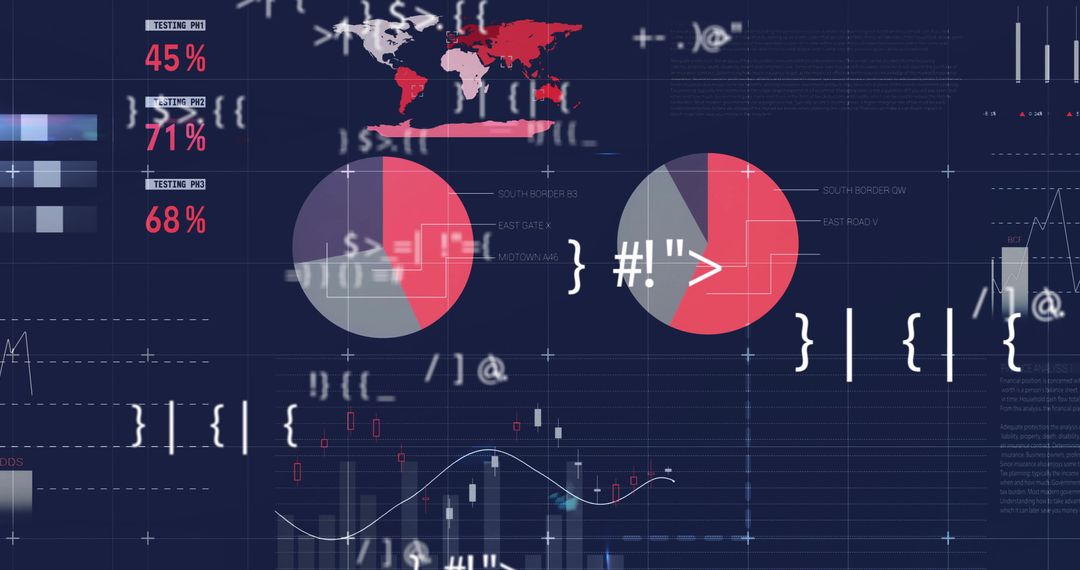
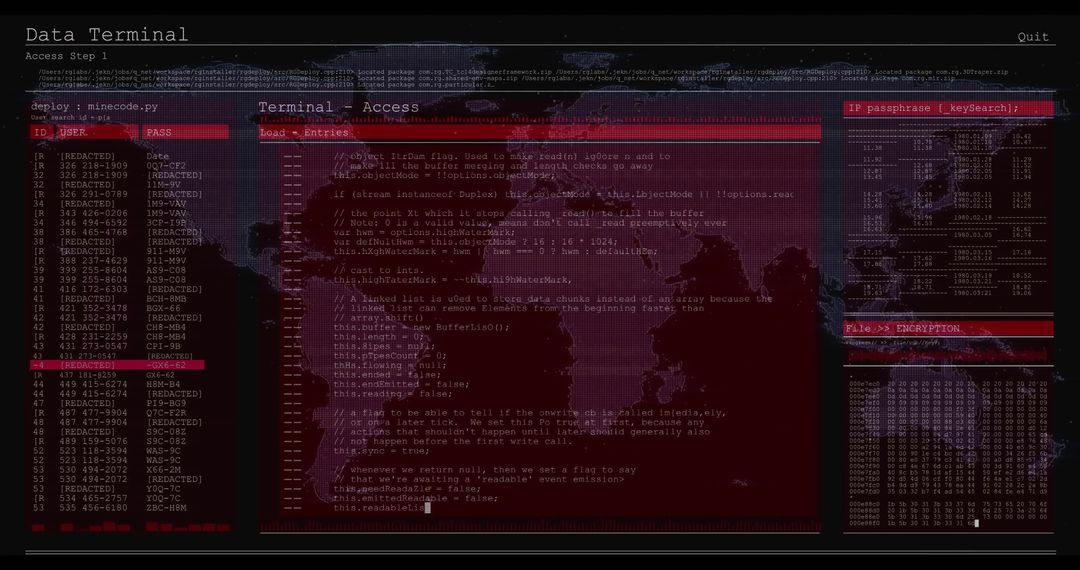
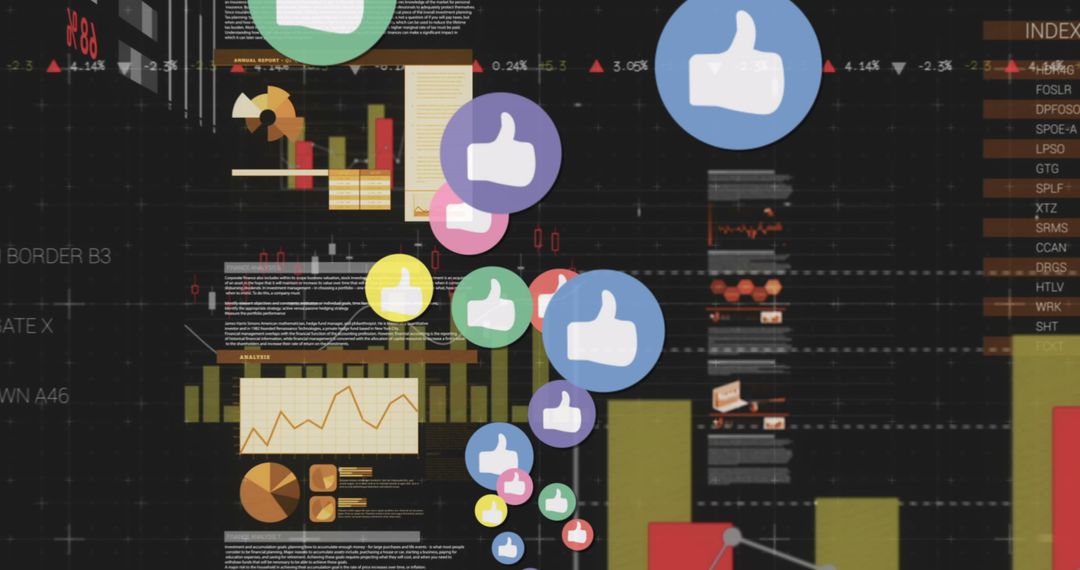
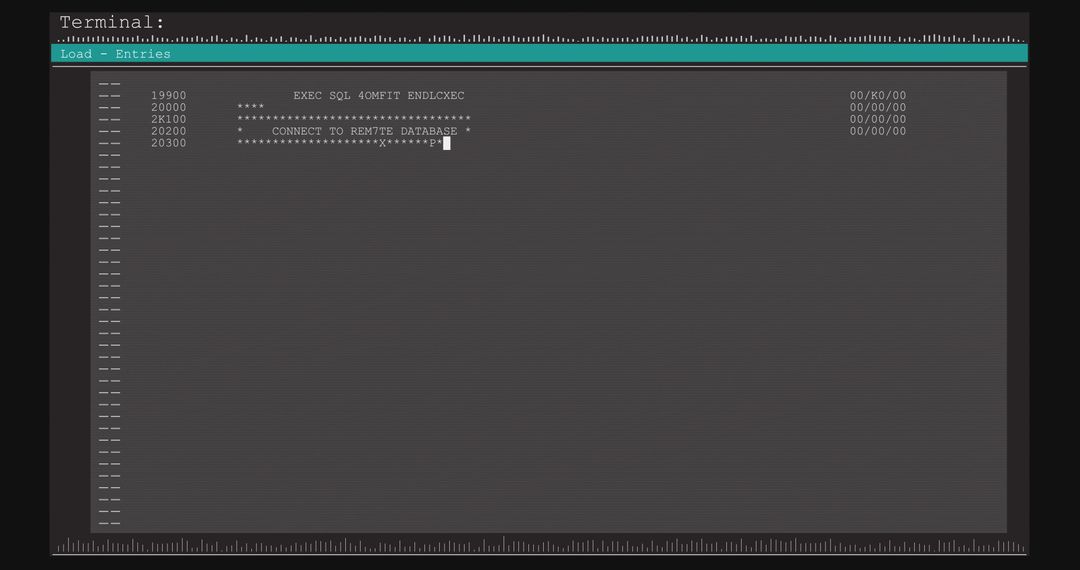
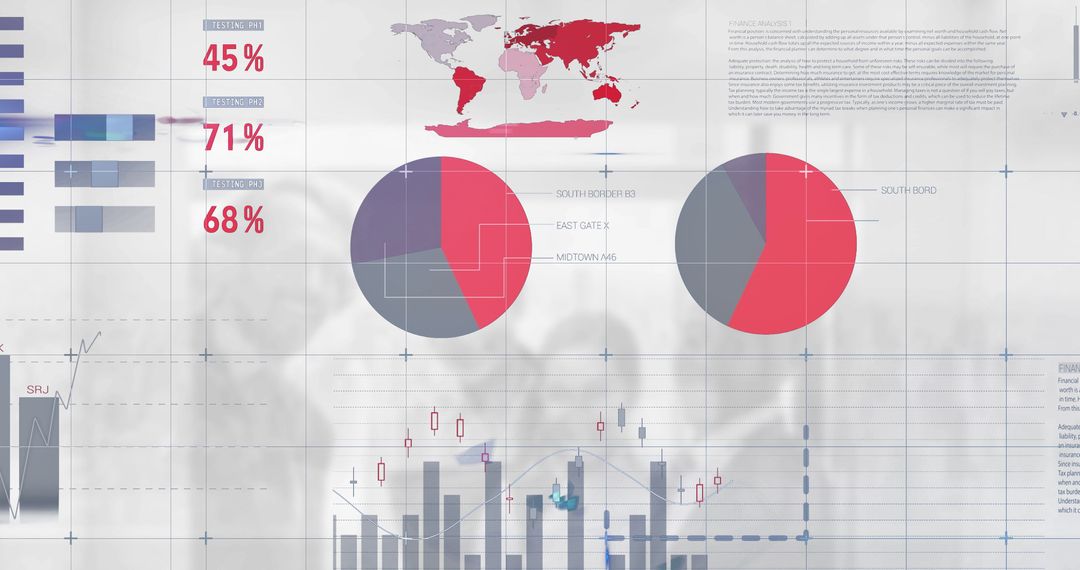
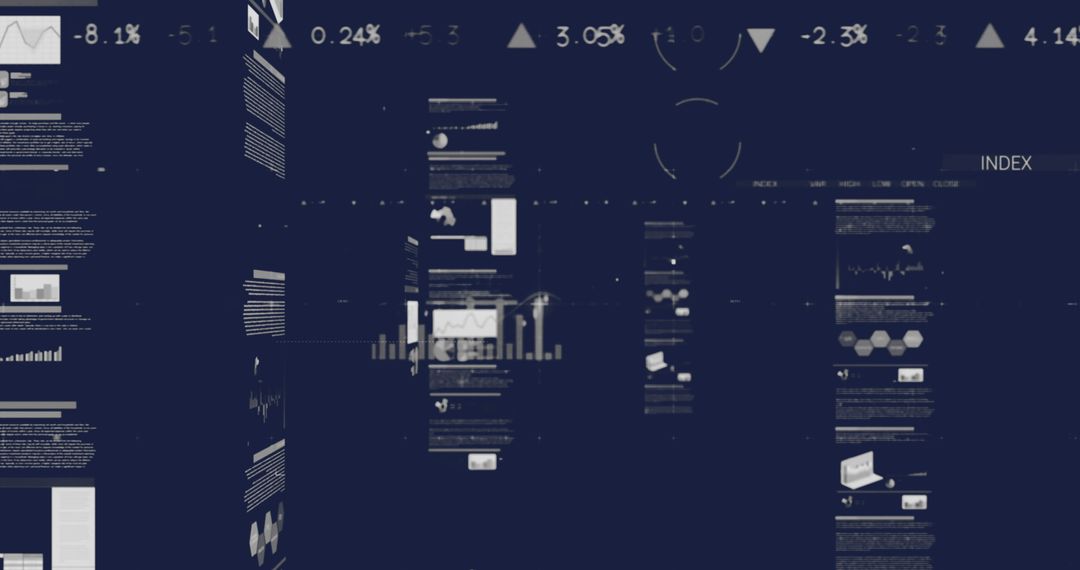
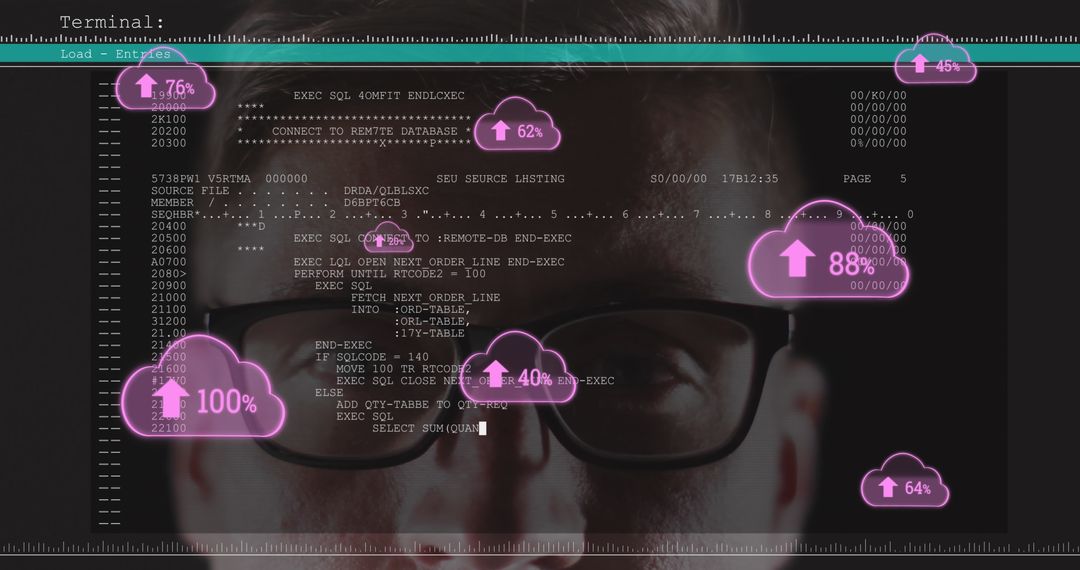
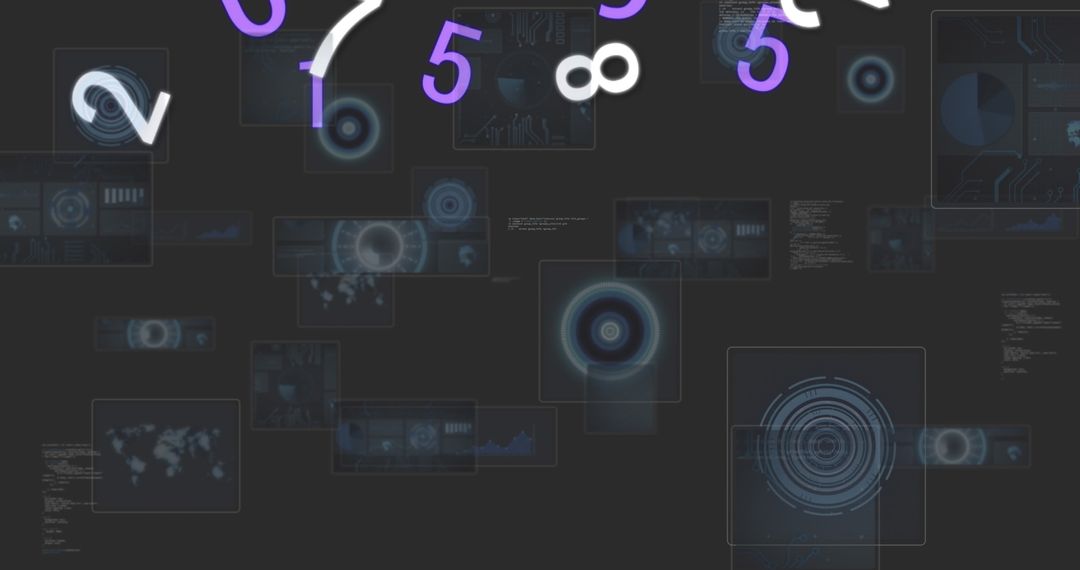
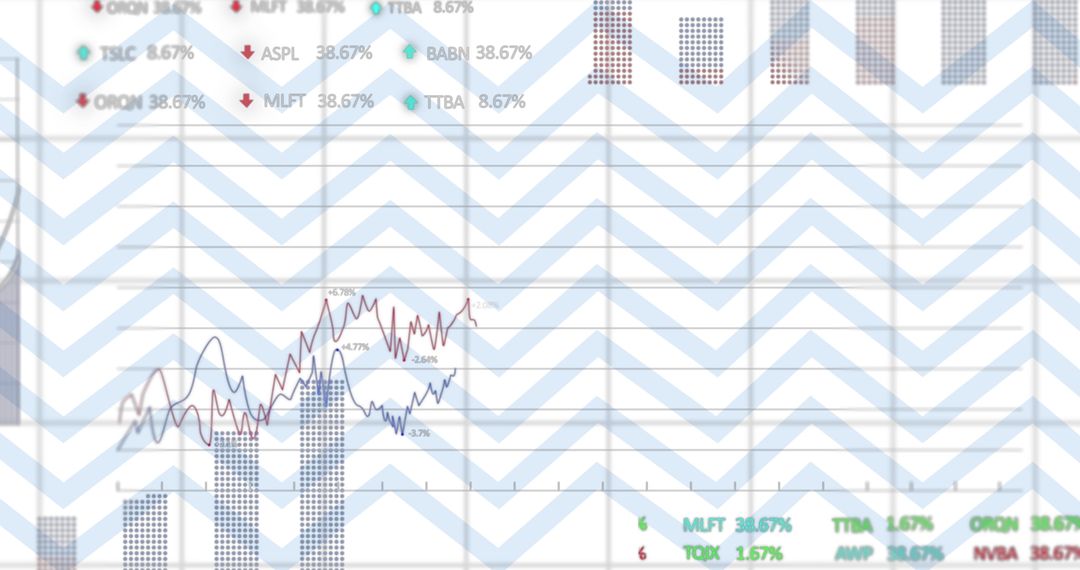
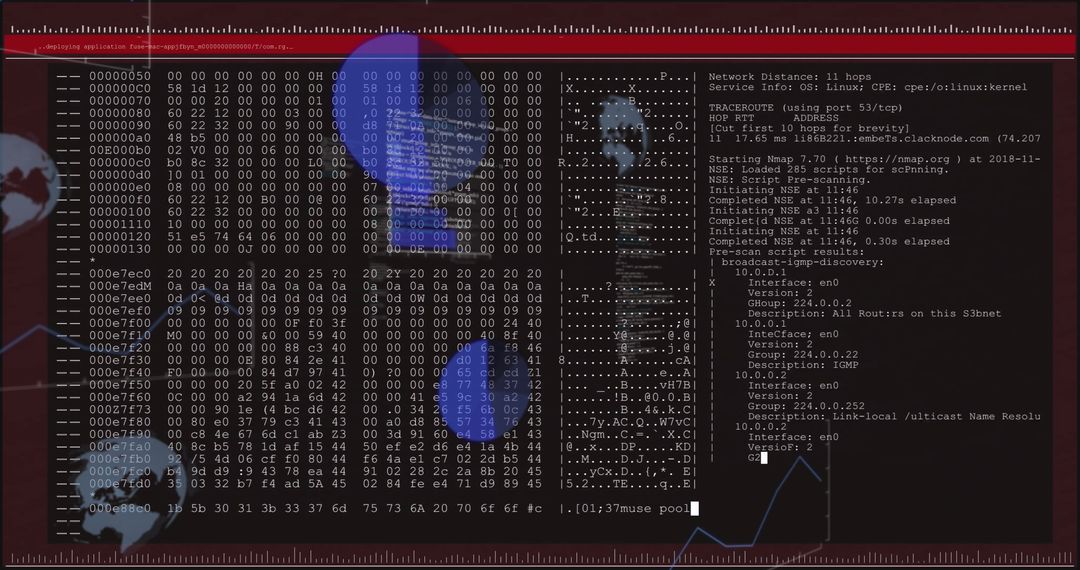
- Interactive Financial Dashboard with Playful Heart Graphics
Interactive Financial Dashboard with Playful Heart Graphics Image

Creative integration of financial data with world maps and flow charts showing diverse statistics. Pink heart graphics add unique playful twist, aligning serious business theme with creative elements. Suitable for presentations, social media campaigns, or marketing to highlight innovative thinking, blend of finance and creativity, appealing analytical visuals.
Powered by  - Get 15% off with code: PIKWIZARD15


4
downloads
downloads
Tags:
More
Credit Photo
If you would like to credit the Photo, here are some ways you can do so
Text Link
photo Link
<span class="text-link">
<span>
<a target="_blank" href=https://pikwizard.com/photo/interactive-financial-dashboard-with-playful-heart-graphics/5285263d57980351b0790302a7661790/>PikWizard</a>
</span>
</span>
<span class="image-link">
<span
style="margin: 0 0 20px 0; display: inline-block; vertical-align: middle; width: 100%;"
>
<a
target="_blank"
href="https://pikwizard.com/photo/interactive-financial-dashboard-with-playful-heart-graphics/5285263d57980351b0790302a7661790/"
style="text-decoration: none; font-size: 10px; margin: 0;"
>
<img src="https://pikwizard.com/pw/medium/5285263d57980351b0790302a7661790.jpg" style="margin: 0; width: 100%;" alt="" />
<p style="font-size: 12px; margin: 0;">PikWizard</p>
</a>
</span>
</span>
Free (free of charge)
Free for personal and commercial use.
Author: Creative Art
Similar Free Stock Images

Premium


Premium


Premium


Premium


Premium


Premium


Premium


Premium


Premium


Premium


Premium


Premium


Premium


Premium


Premium


Premium


Premium


Premium


Premium


Premium


Premium


Premium


Premium


Premium

