
- Home >
- Stock Photos >
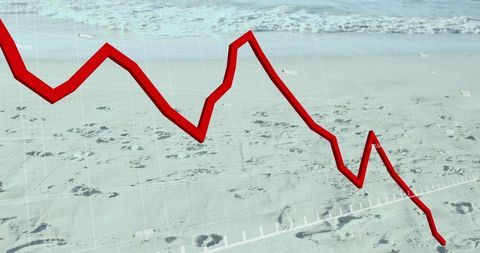
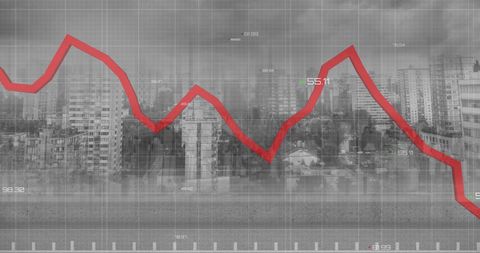
- Interactive Financial Graph with Economics Concept
Interactive Financial Graph with Economics Concept Image

Dynamic visualization prominently displaying financial trends through intersecting line and pie charts against complex data grid implies economic analysis. Represents business environments, market monitoring, corporate finance activities. Suitable for finance and investment reports, economic dashboard presentations, analytical articles, teaching resource for illustrating fluctuating trends.
Powered by  - Get 15% off with code: PIKWIZARD15


1
downloads
downloads
Tags:
More
Credit Photo
If you would like to credit the Photo, here are some ways you can do so
Text Link
photo Link
<span class="text-link">
<span>
<a target="_blank" href=https://pikwizard.com/photo/interactive-financial-graph-with-economics-concept/bdd50a6b6b82770ea988b5092c0fc42d/>PikWizard</a>
</span>
</span>
<span class="image-link">
<span
style="margin: 0 0 20px 0; display: inline-block; vertical-align: middle; width: 100%;"
>
<a
target="_blank"
href="https://pikwizard.com/photo/interactive-financial-graph-with-economics-concept/bdd50a6b6b82770ea988b5092c0fc42d/"
style="text-decoration: none; font-size: 10px; margin: 0;"
>
<img src="https://pikwizard.com/pw/medium/bdd50a6b6b82770ea988b5092c0fc42d.jpg" style="margin: 0; width: 100%;" alt="" />
<p style="font-size: 12px; margin: 0;">PikWizard</p>
</a>
</span>
</span>
Free (free of charge)
Free for personal and commercial use.
Author: Authentic Images
Similar Free Stock Images
Loading...

Premium


Premium


Premium


Premium

Premium

Premium


Premium


Premium


Premium


Premium

Premium

Premium

Premium


Premium


Premium


Premium


Premium


Premium


Premium


Premium


Premium

Premium


Premium


Premium


Premium
