- Home >
- Stock Photos >
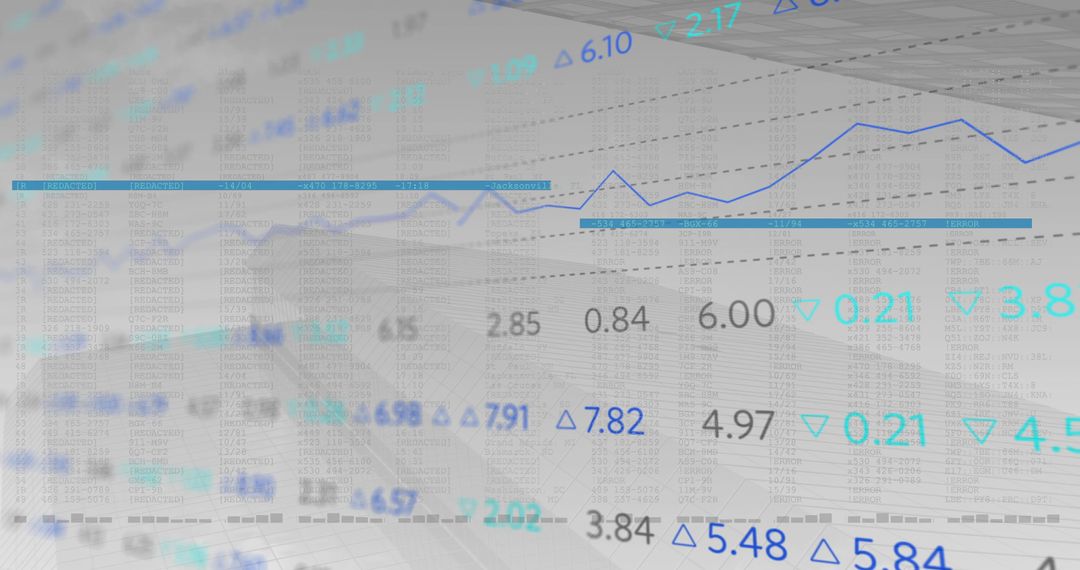
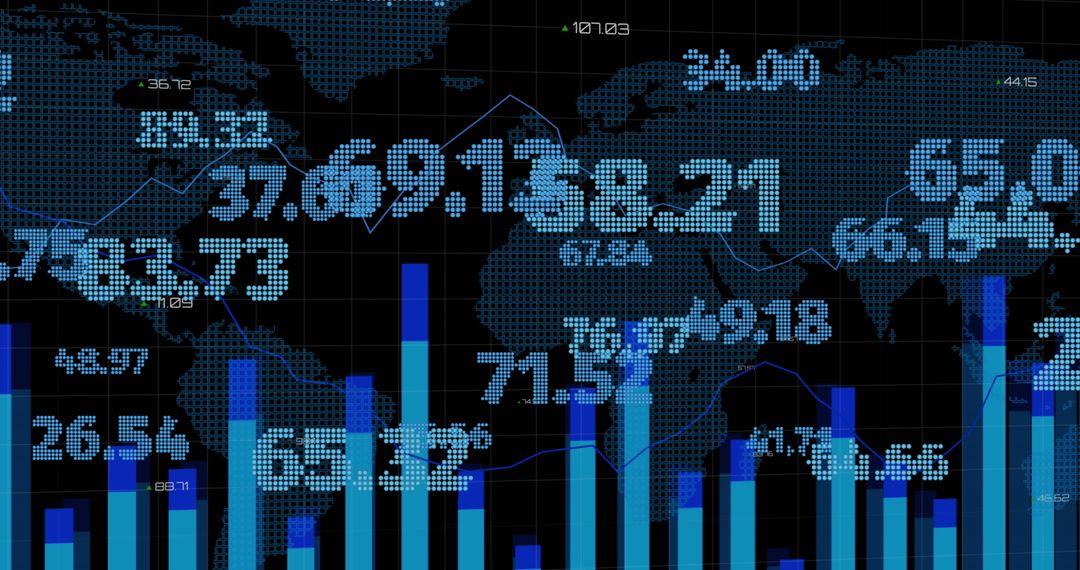
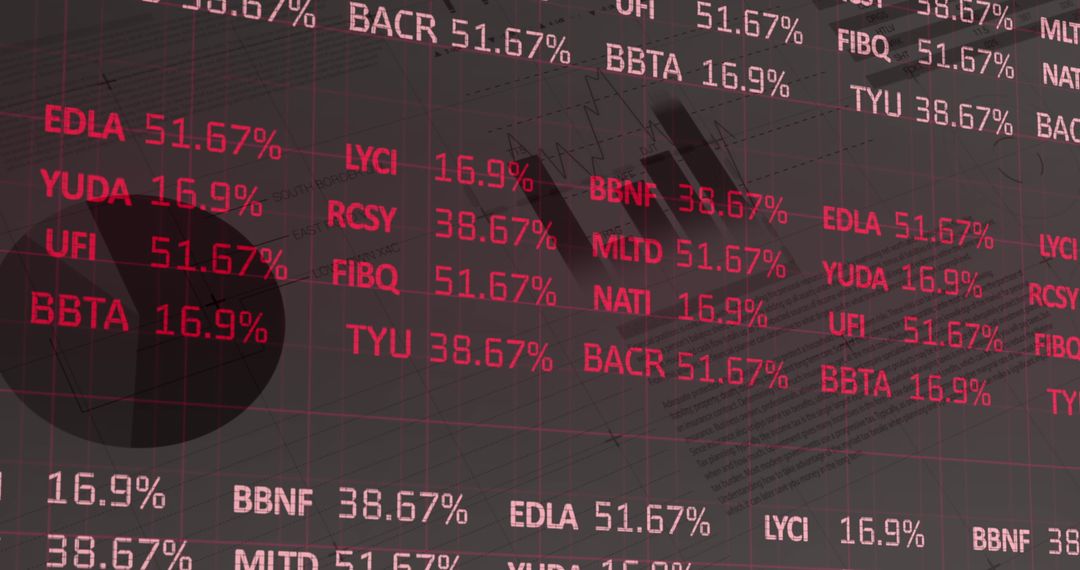
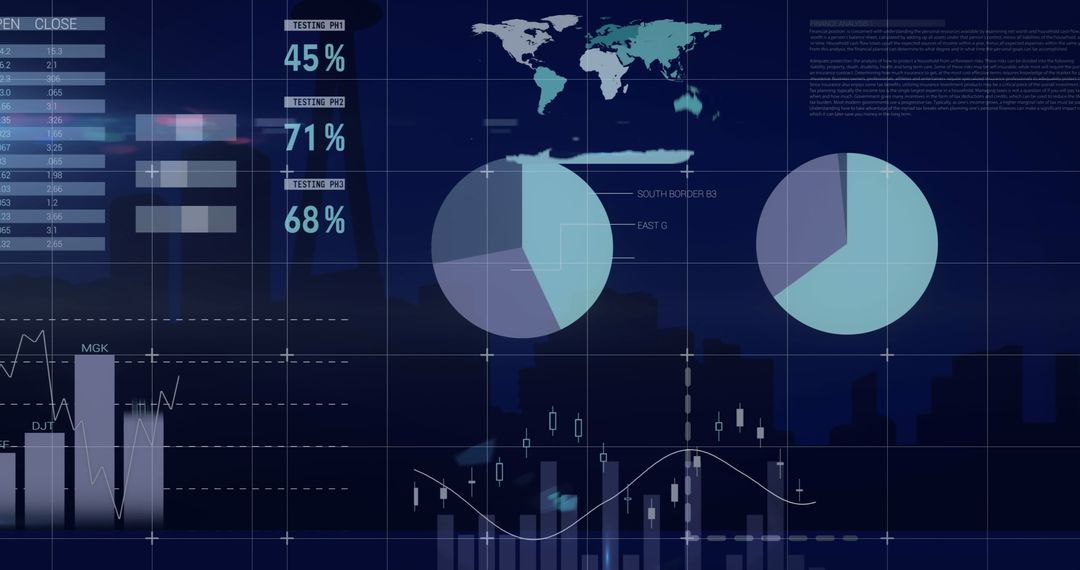
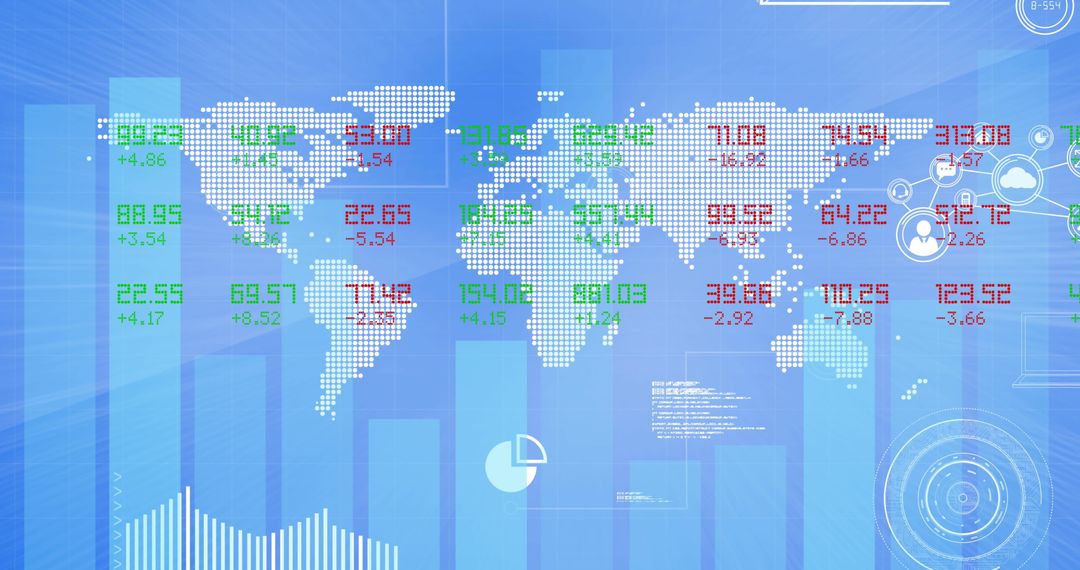
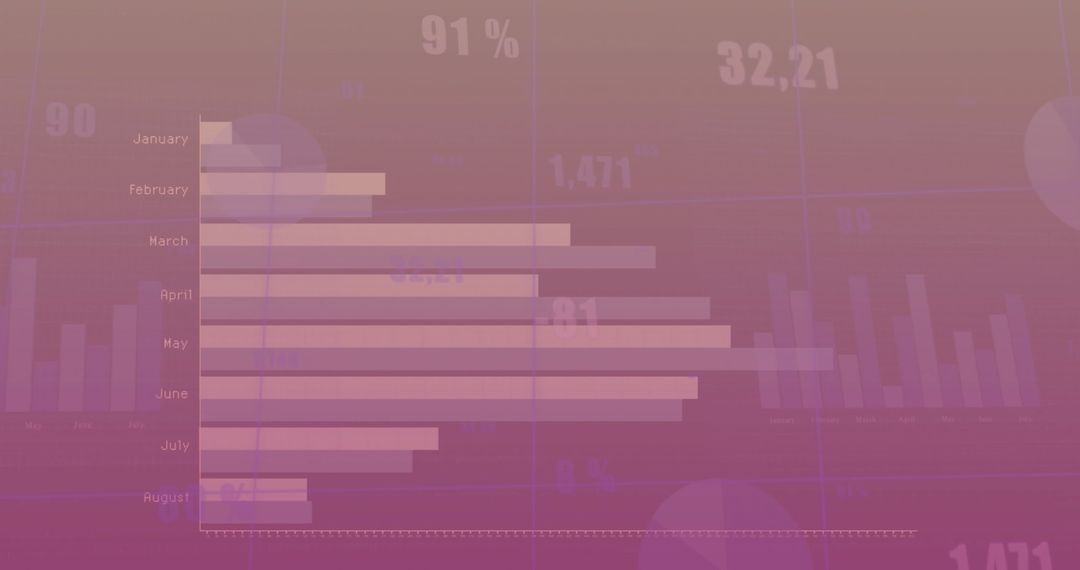
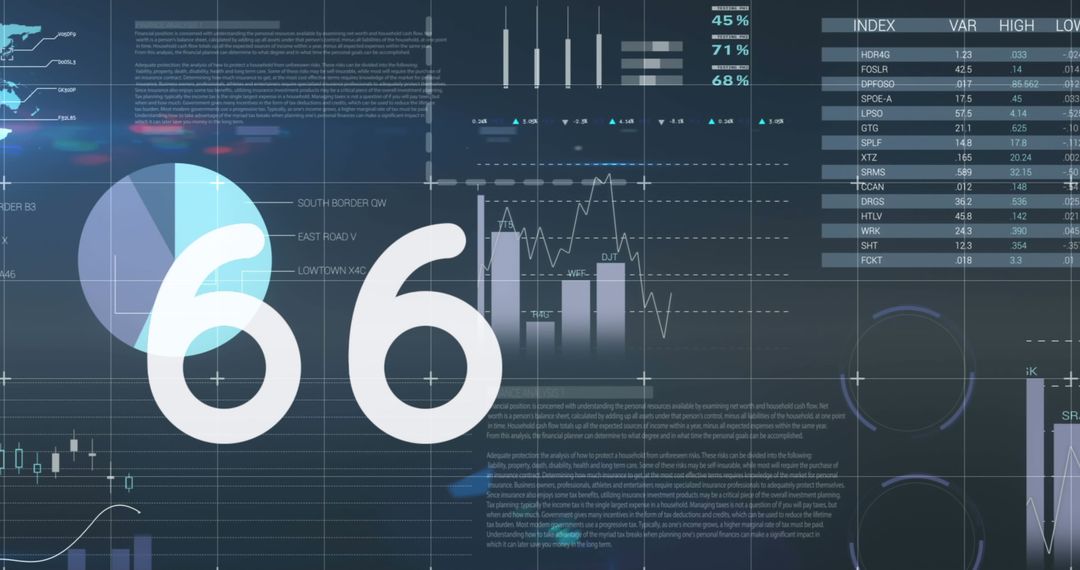
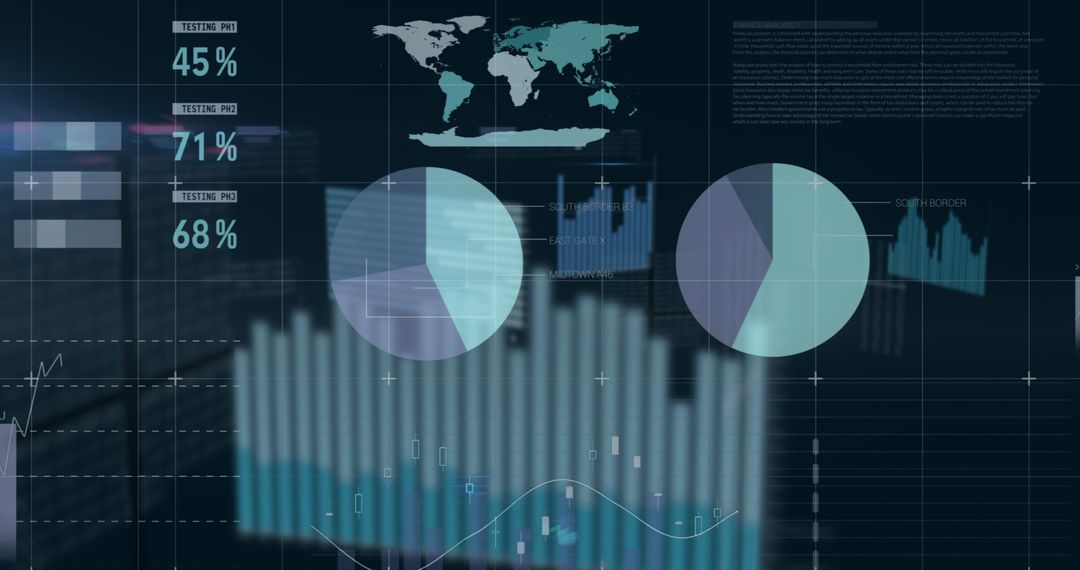
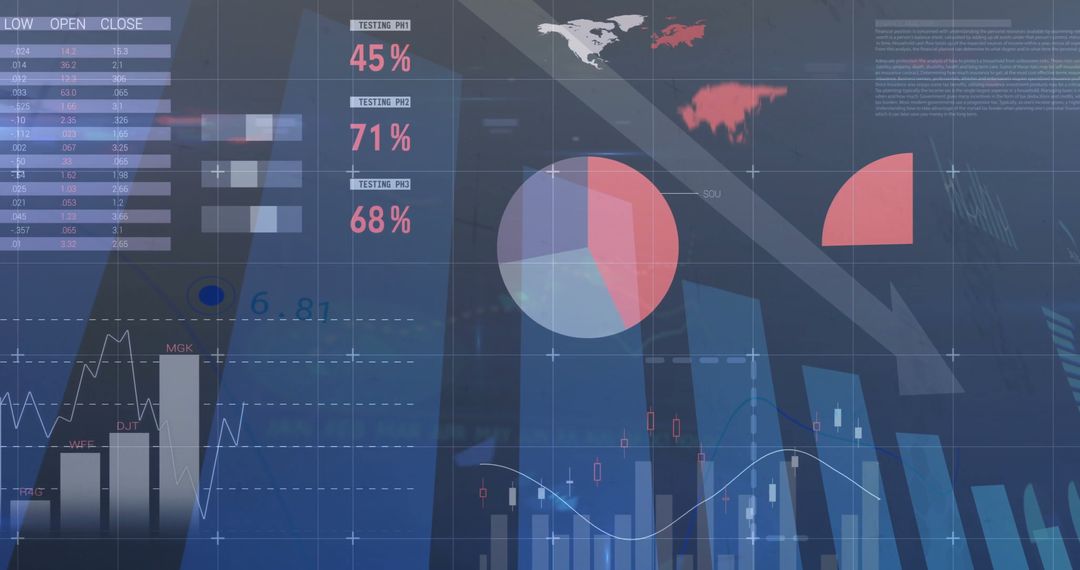
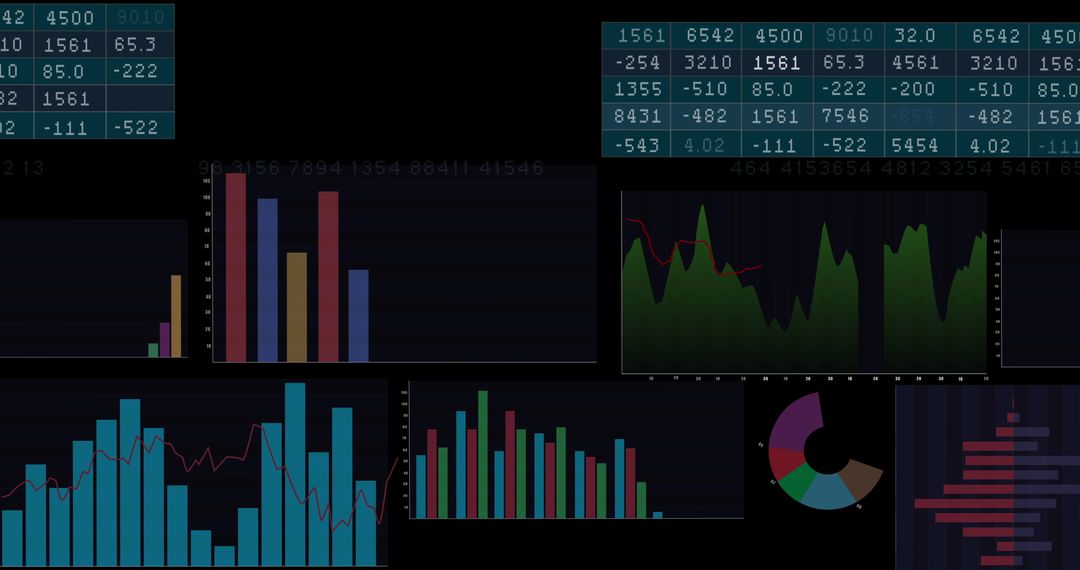
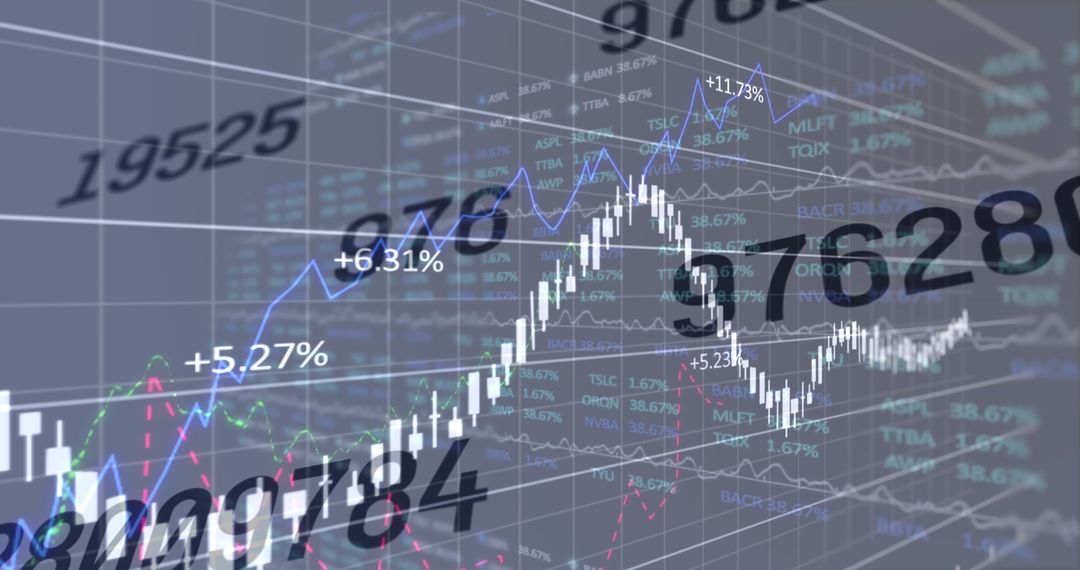
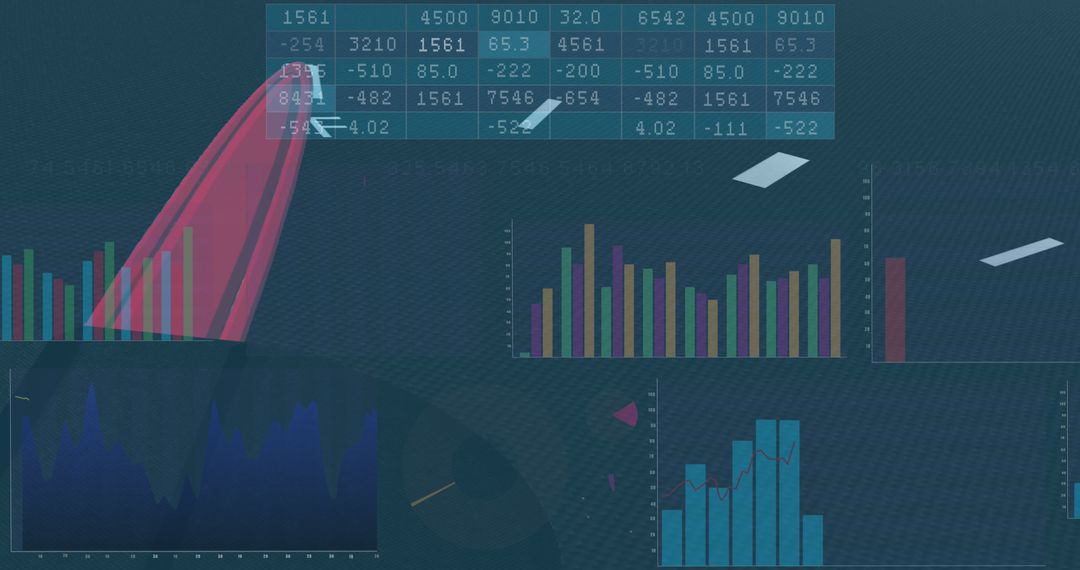
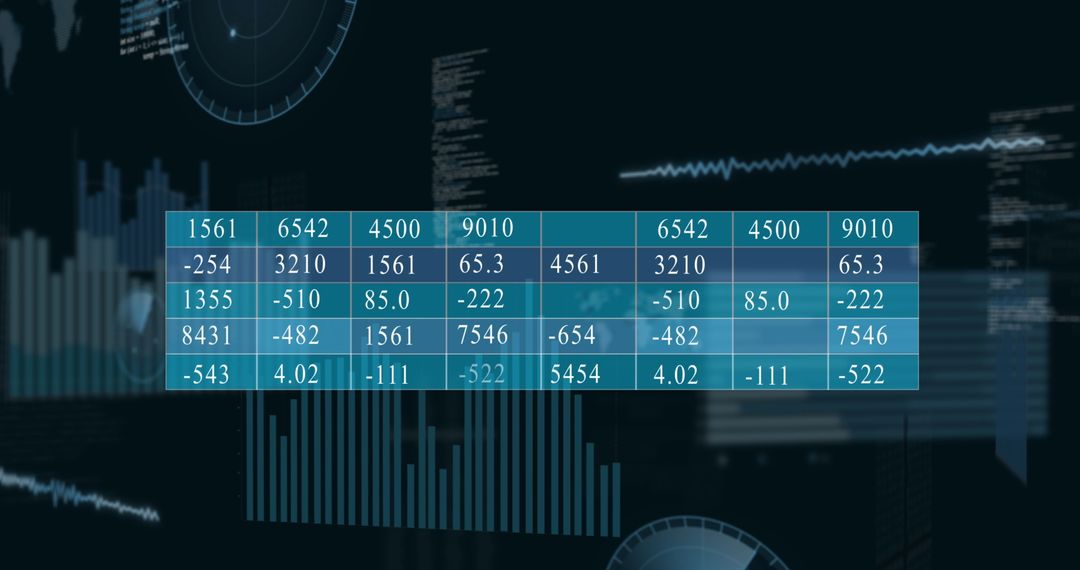
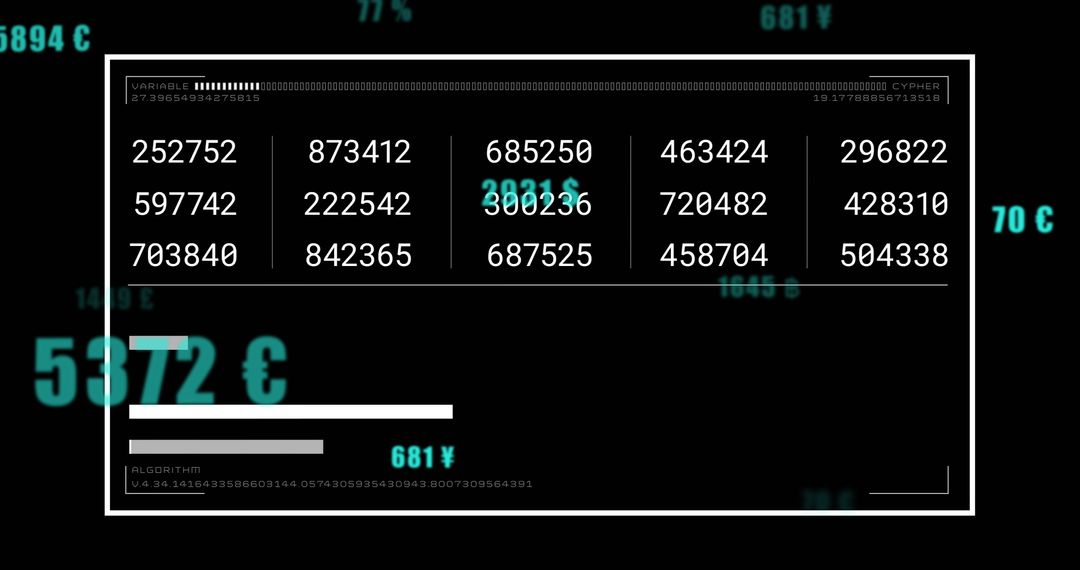
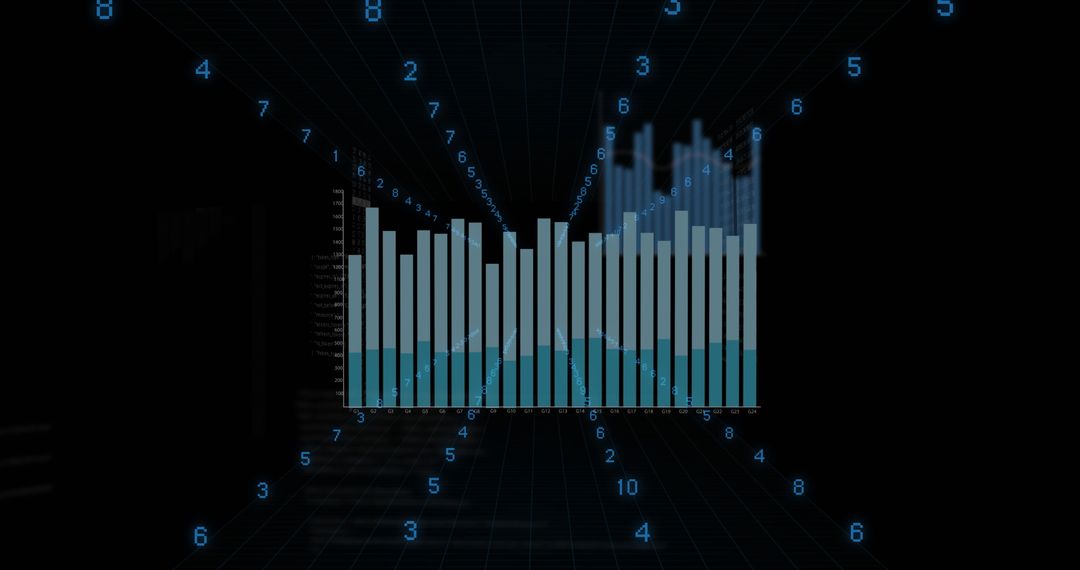
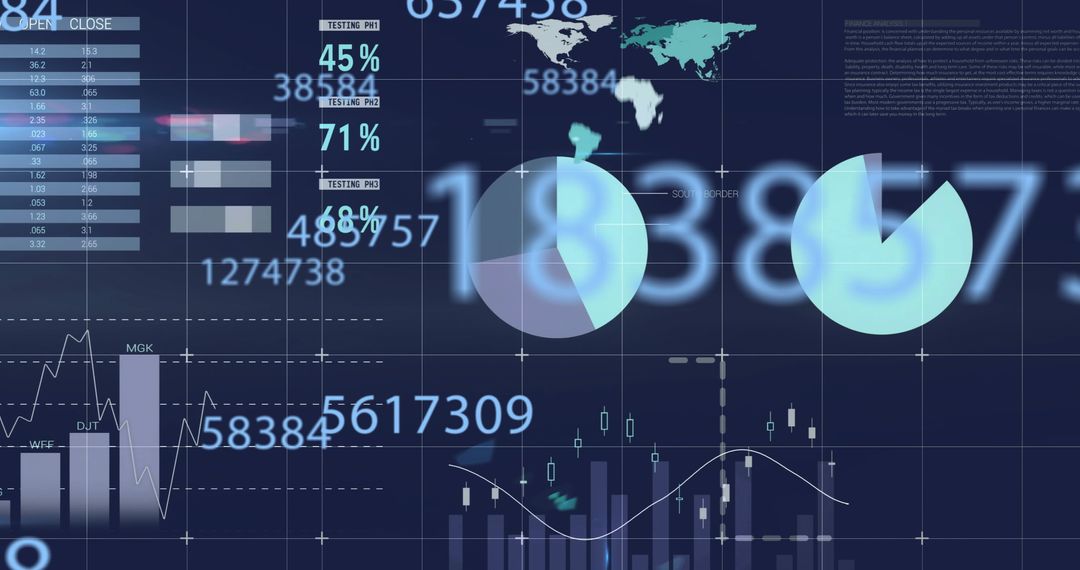
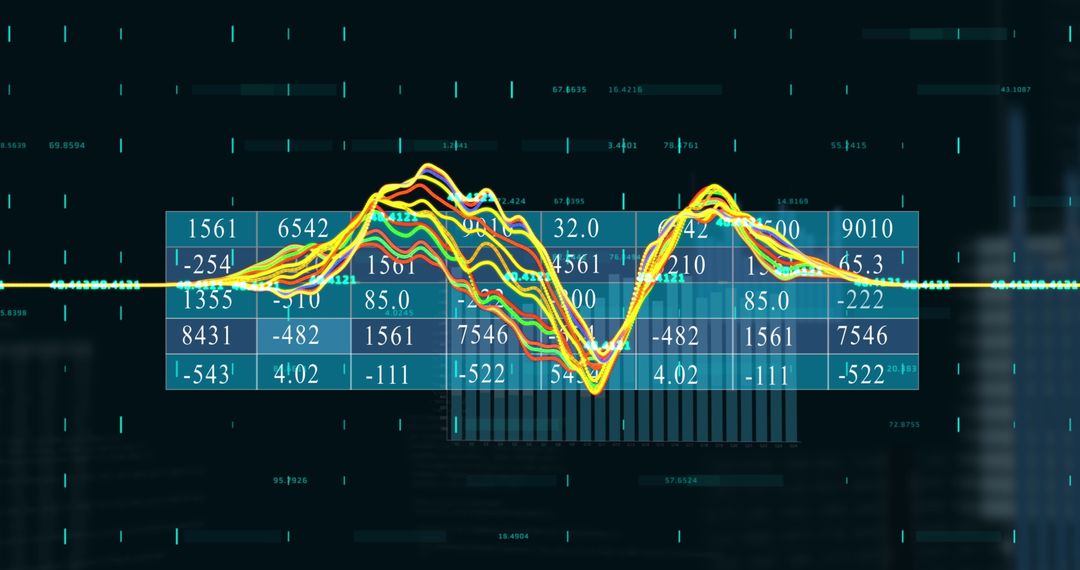
- Interactive Financial Graphs Displaying Market Trends and Data
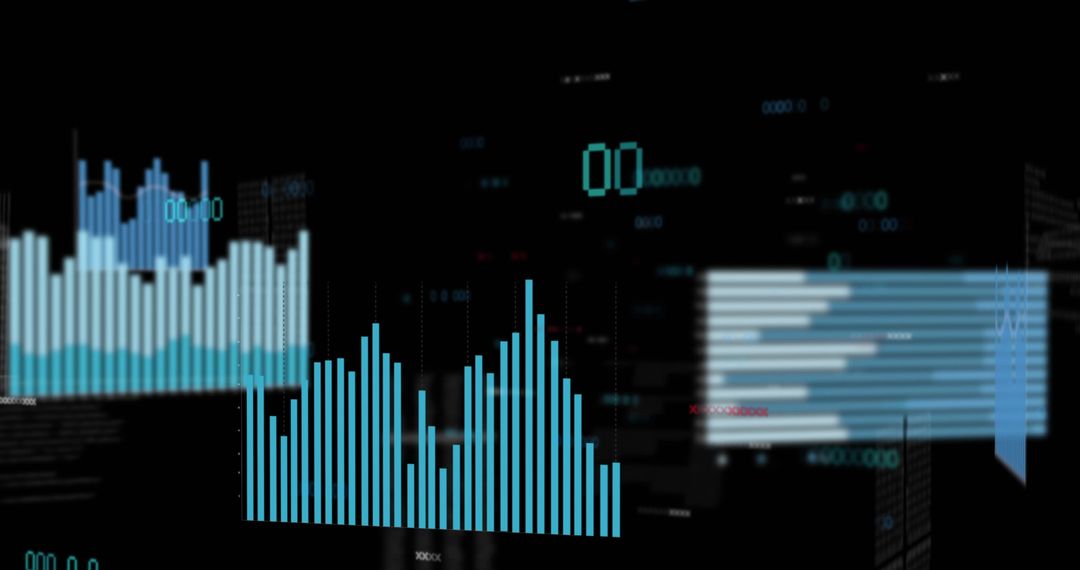
Interactive Financial Graphs Displaying Market Trends and Data Image
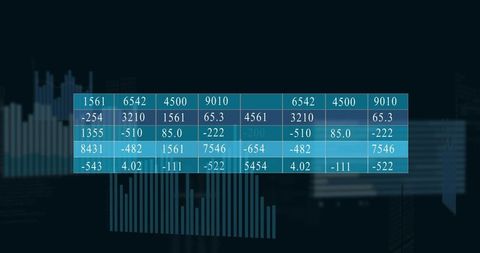
Digital depiction shows multiple financial graphs and data on a dark background, representing market trends. Useful for presentations, financial reports, or educational materials concerning stocks, finance, business analytics, or global economy topics.
Powered by  - Get 15% off with code: PIKWIZARD15


2
downloads
downloads
Tags:
More
Credit Photo
If you would like to credit the Photo, here are some ways you can do so
Text Link
photo Link
<span class="text-link">
<span>
<a target="_blank" href=https://pikwizard.com/photo/interactive-financial-graphs-displaying-market-trends-and-data/4200fdbefc034191c8c7c0f8f3e5899e/>PikWizard</a>
</span>
</span>
<span class="image-link">
<span
style="margin: 0 0 20px 0; display: inline-block; vertical-align: middle; width: 100%;"
>
<a
target="_blank"
href="https://pikwizard.com/photo/interactive-financial-graphs-displaying-market-trends-and-data/4200fdbefc034191c8c7c0f8f3e5899e/"
style="text-decoration: none; font-size: 10px; margin: 0;"
>
<img src="https://pikwizard.com/pw/medium/4200fdbefc034191c8c7c0f8f3e5899e.jpg" style="margin: 0; width: 100%;" alt="" />
<p style="font-size: 12px; margin: 0;">PikWizard</p>
</a>
</span>
</span>
Free (free of charge)
Free for personal and commercial use.
Author: Awesome Content
Similar Free Stock Images
Premium


Premium

Premium


Premium


Premium


Premium


Premium


Premium


Premium


Premium


Premium


Premium


Premium

Premium


Premium


Premium


Premium


Premium


Premium


Premium


Premium


Premium


Premium


Premium