1. Home > 
  2. Stock Photos > 
  3. Interactive Financial Graphs with Industrial Automation Theme

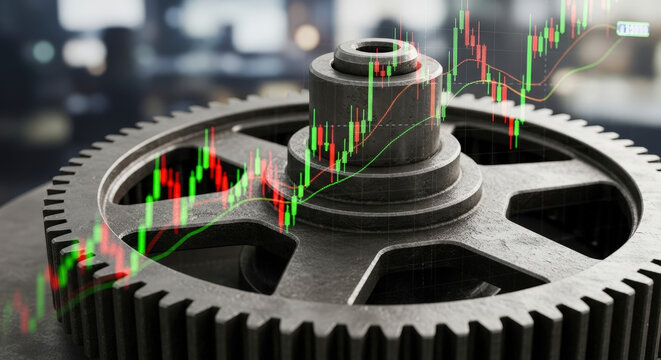
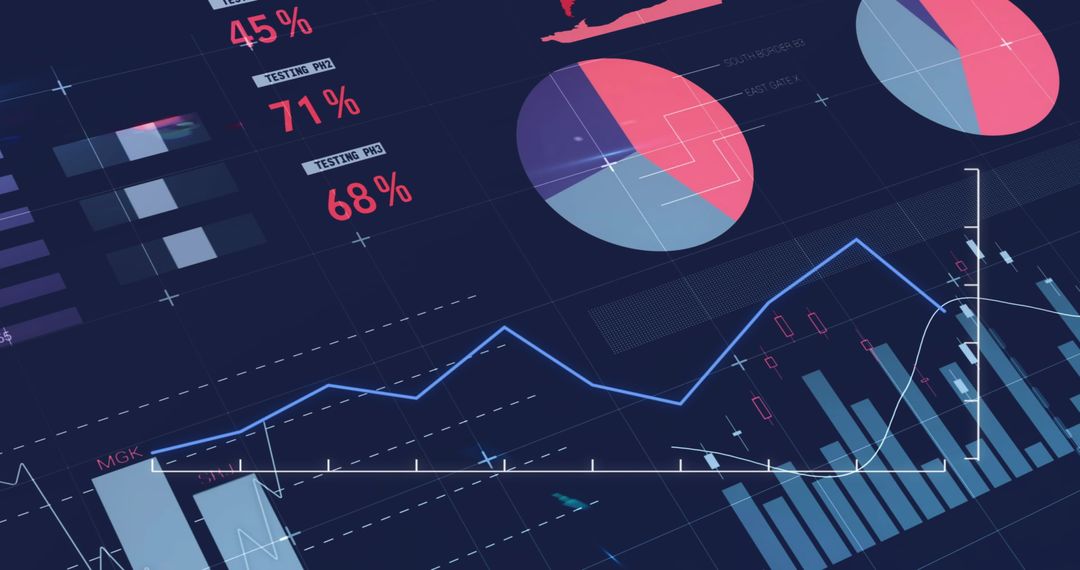
Interactive Financial Graphs with Industrial Automation Theme Image

Interactive Financial Graphs with Industrial Automation Theme

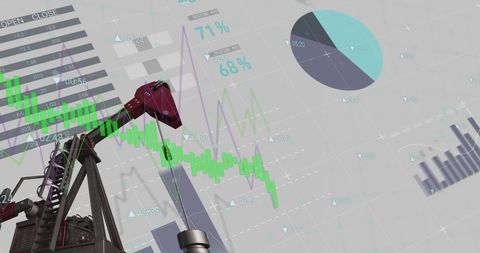
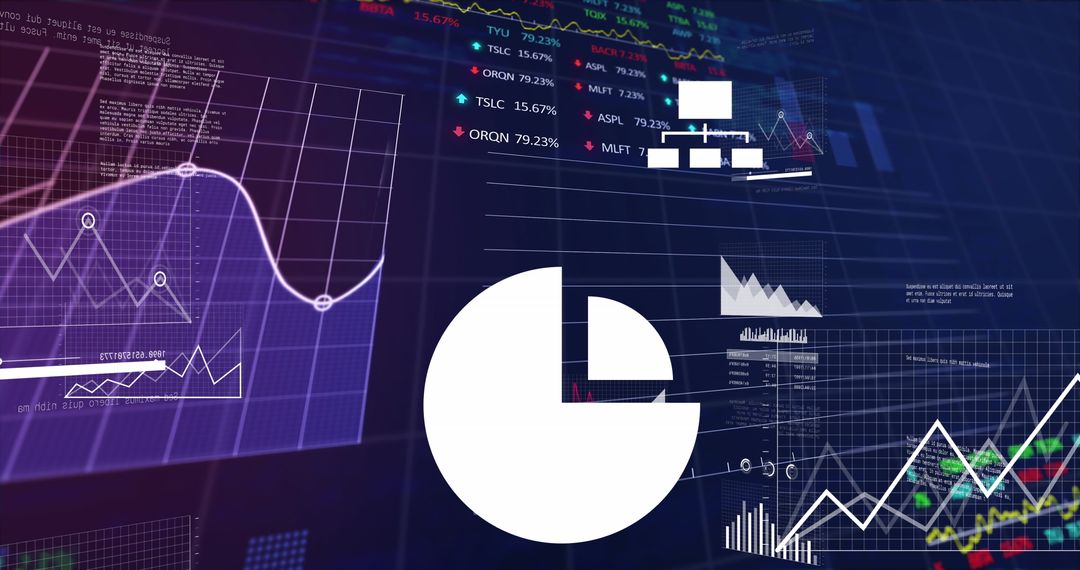
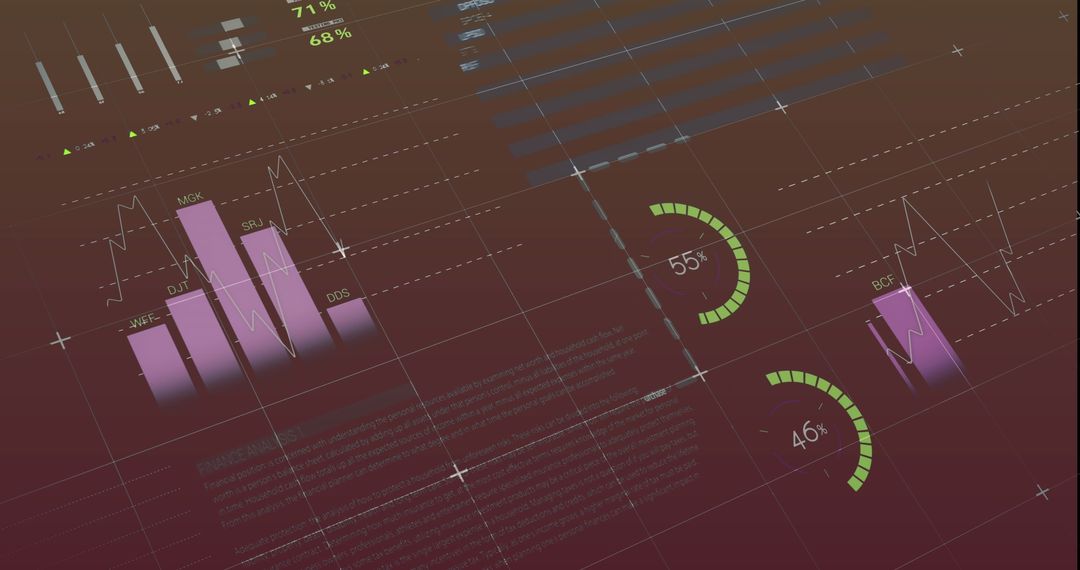
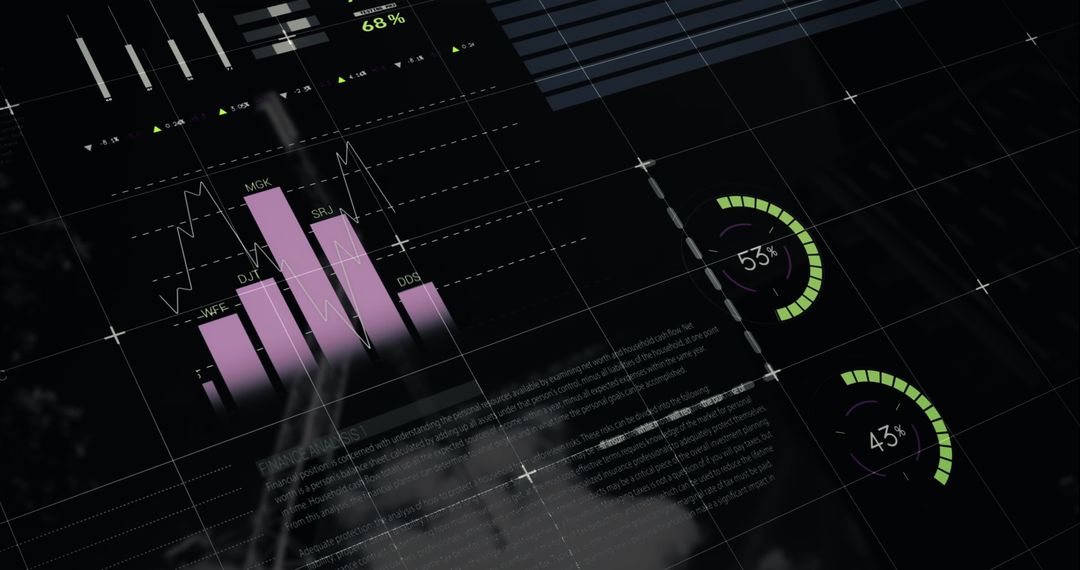
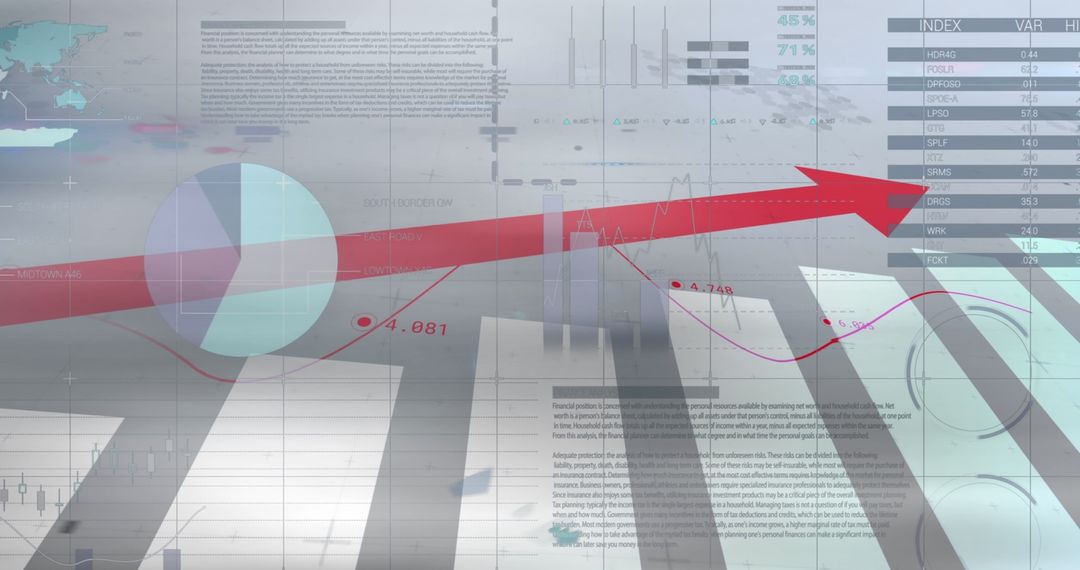
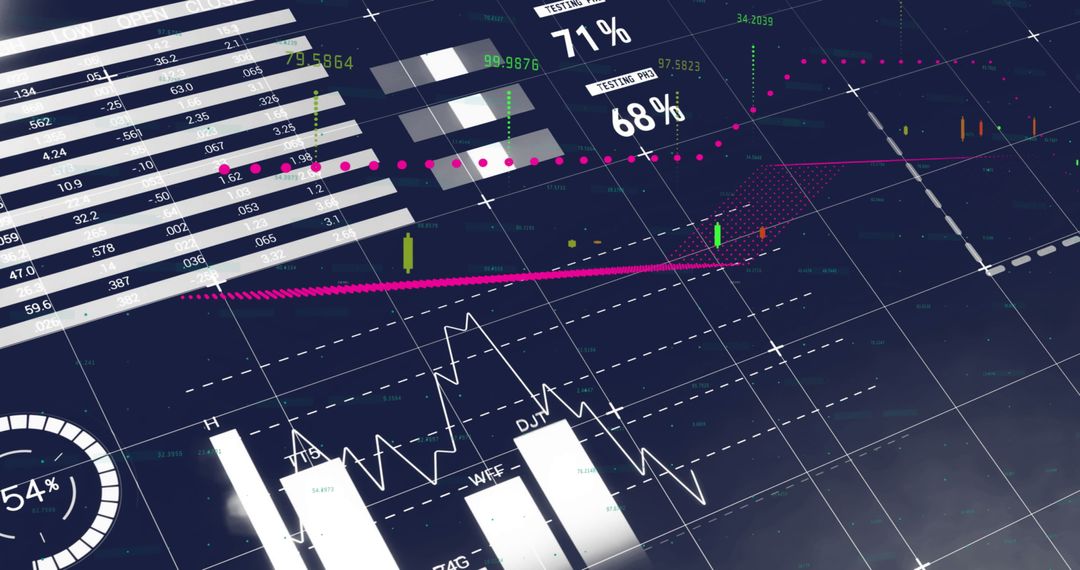
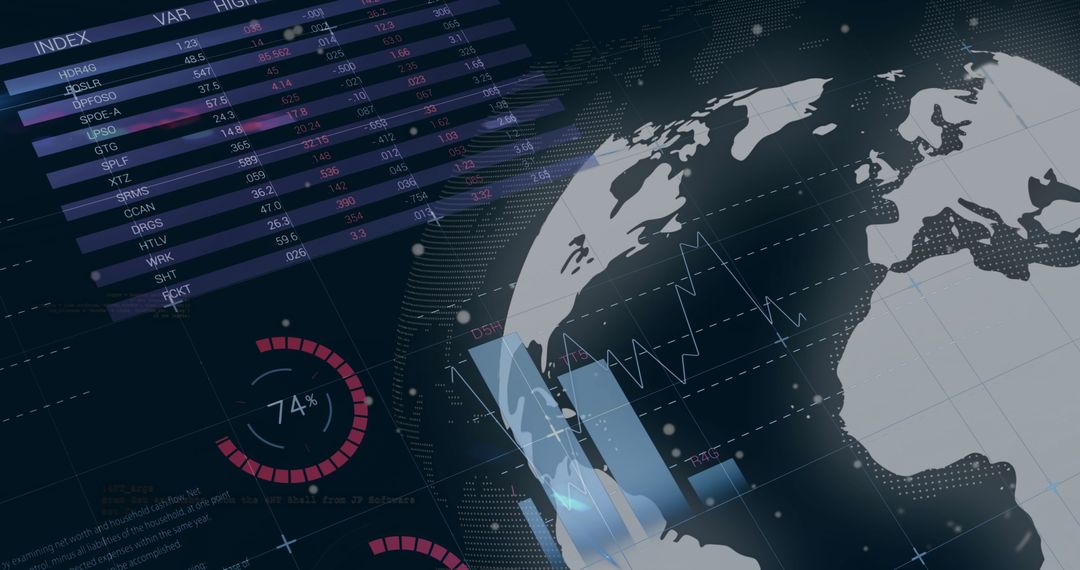
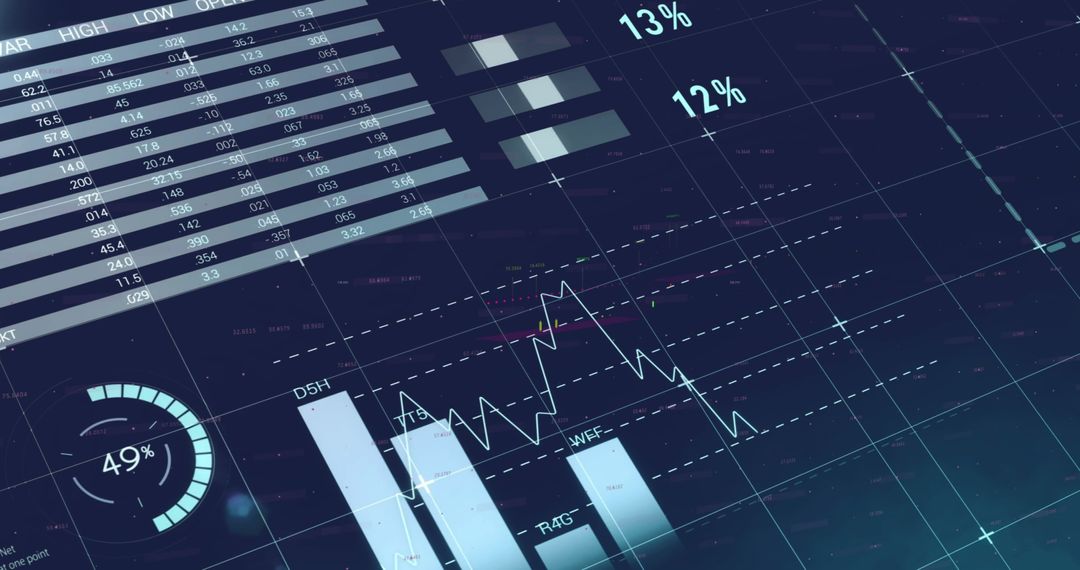
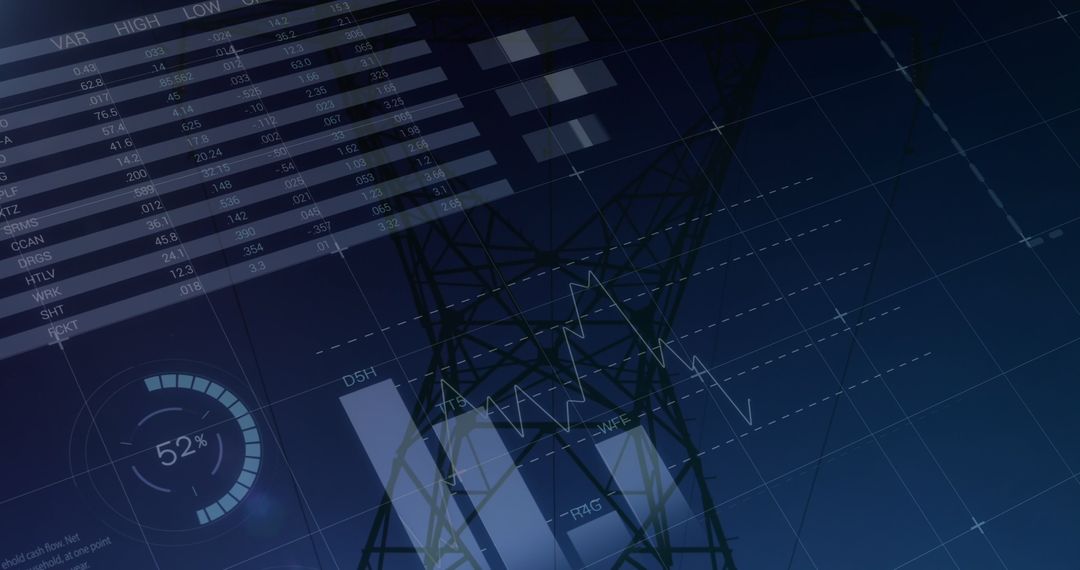
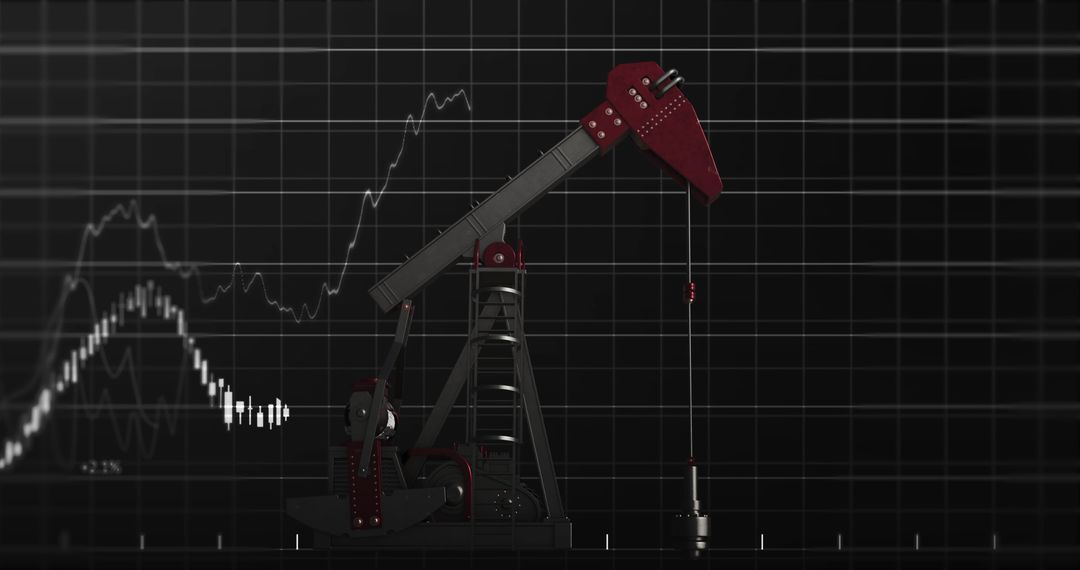
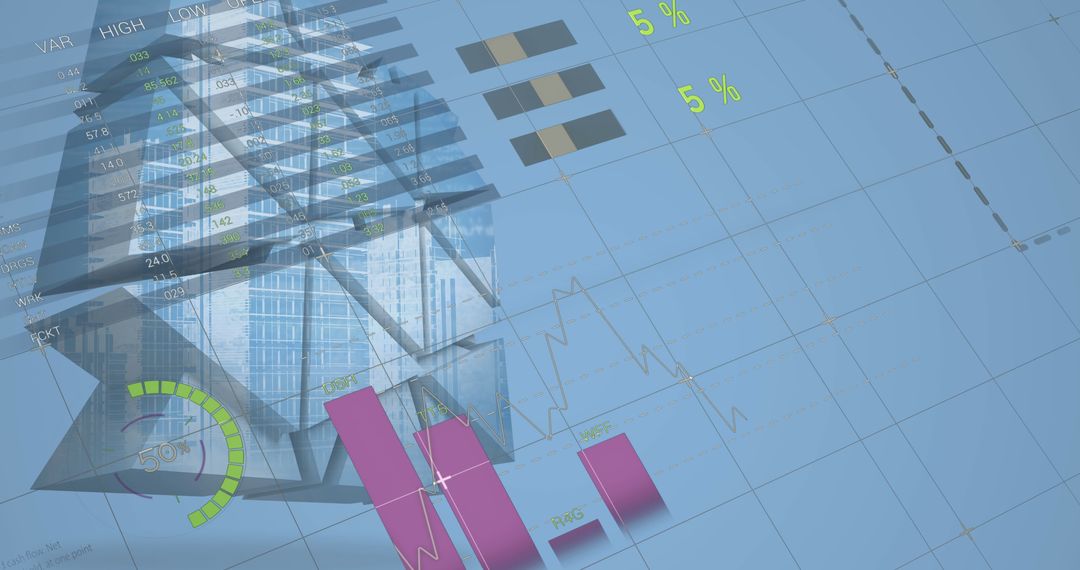
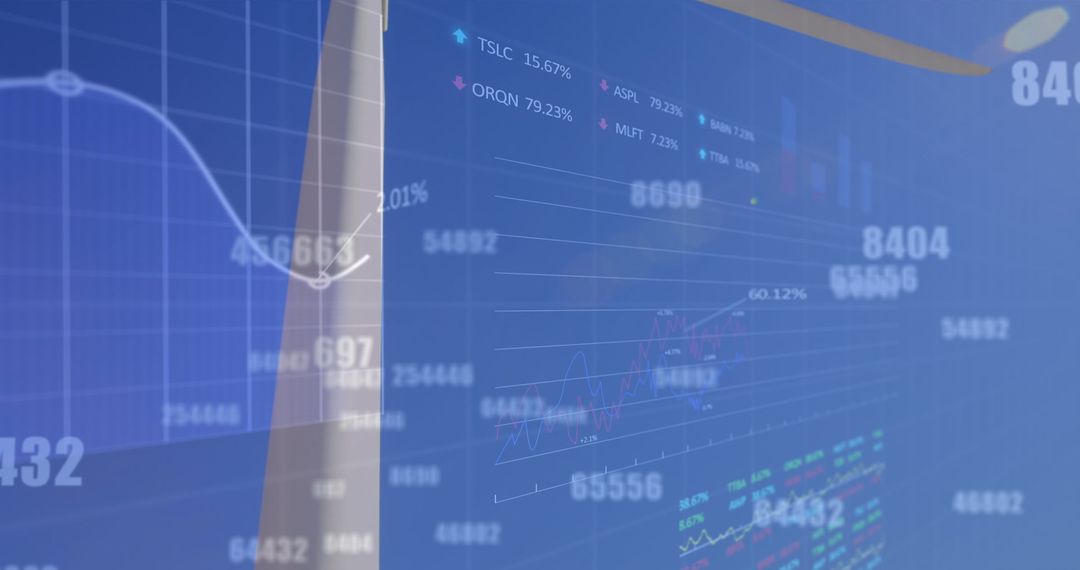
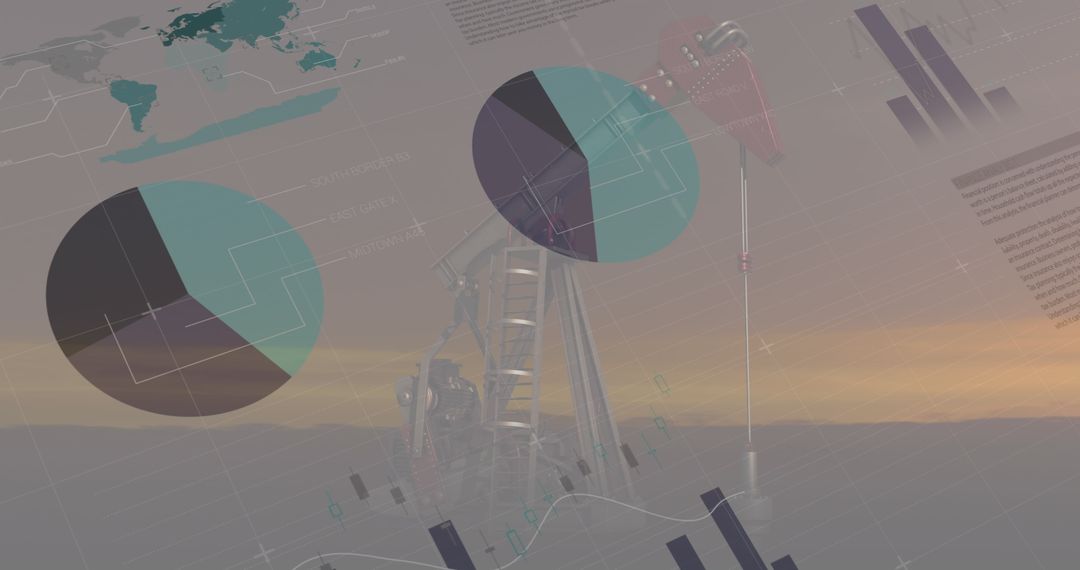
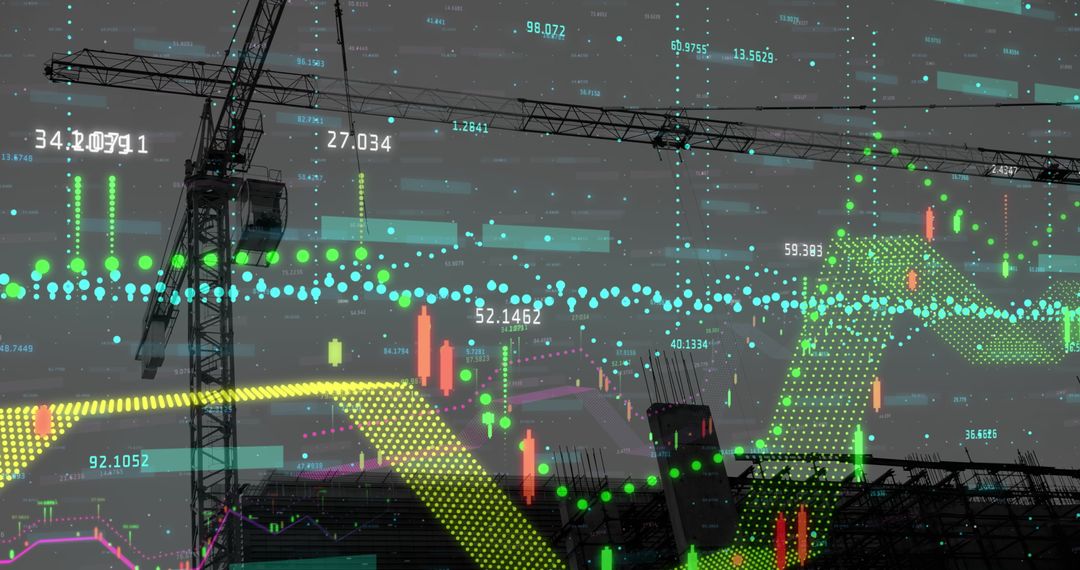
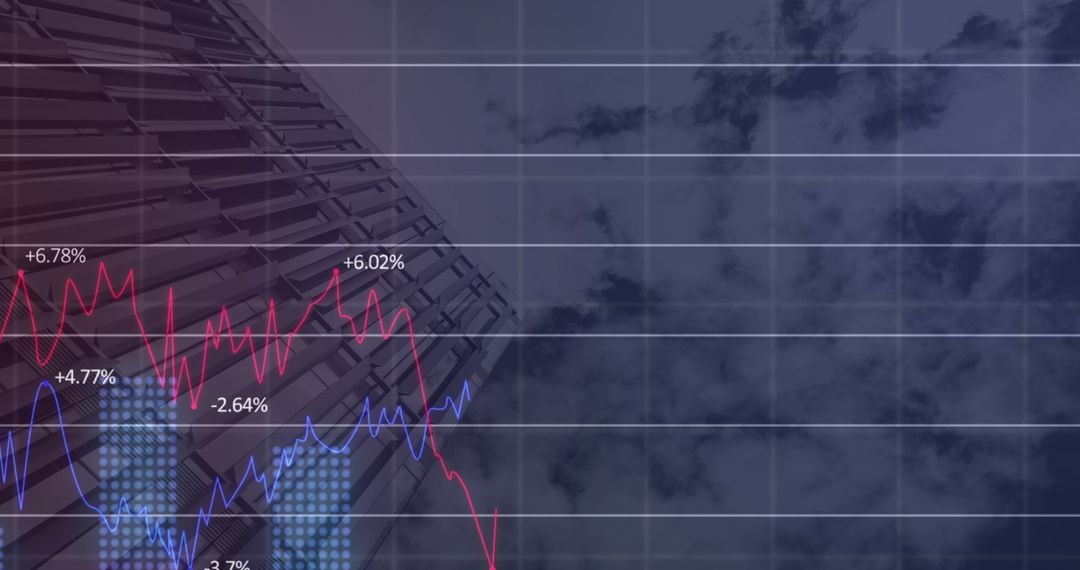
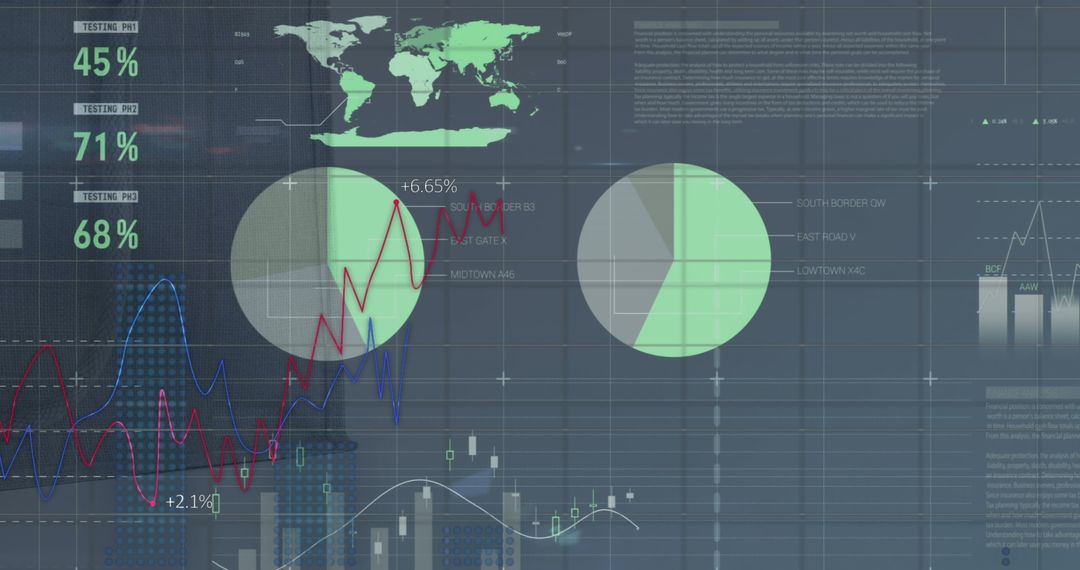
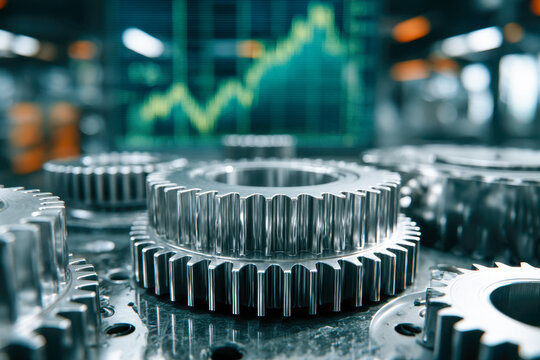
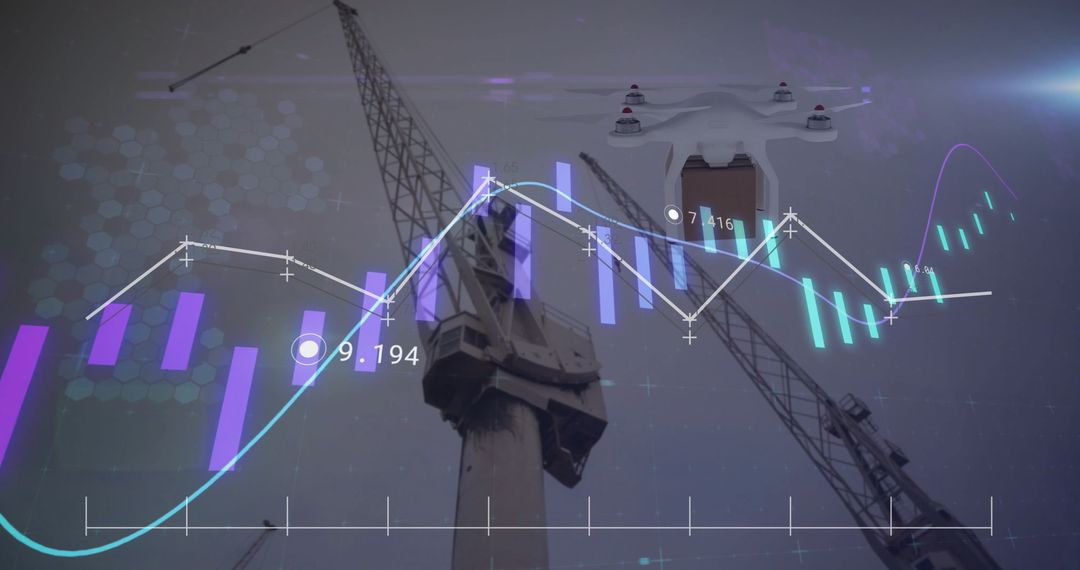
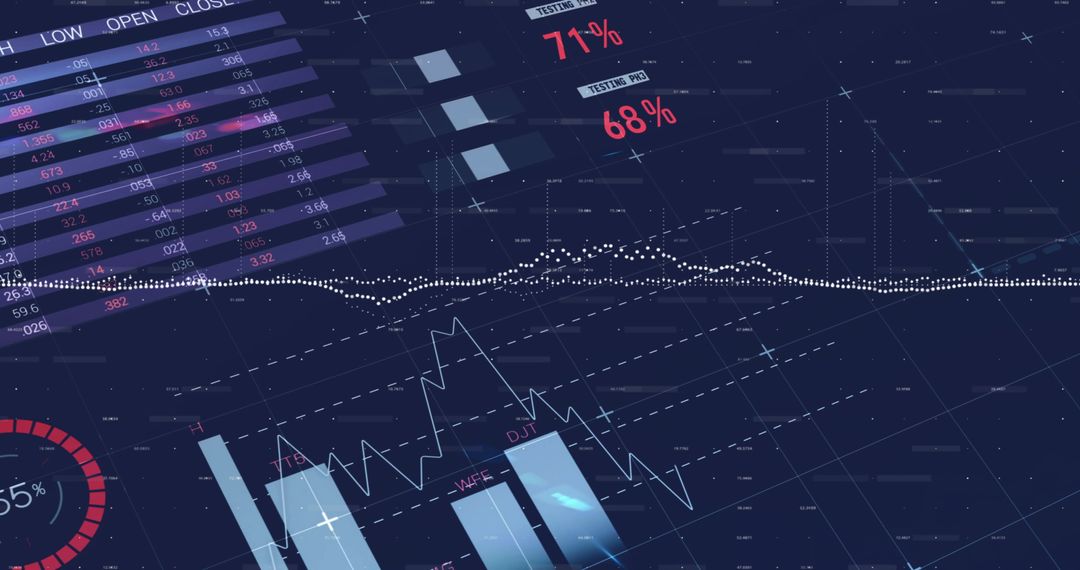
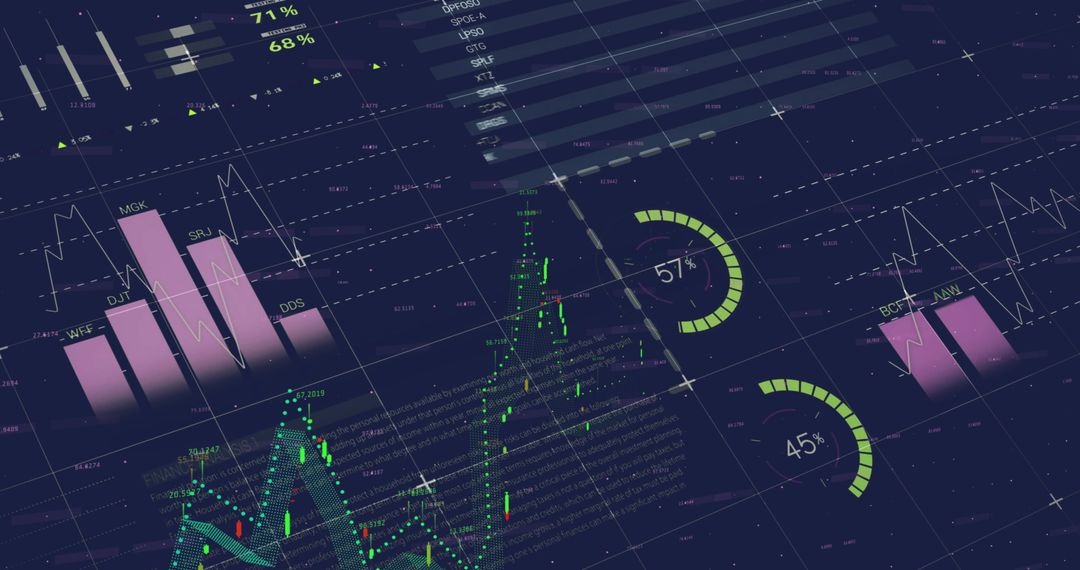
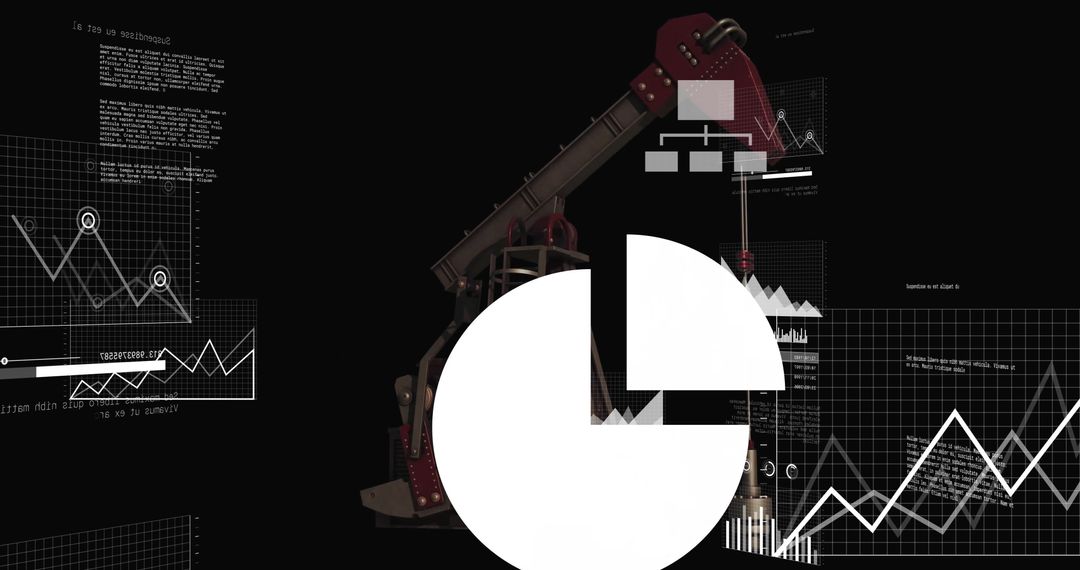
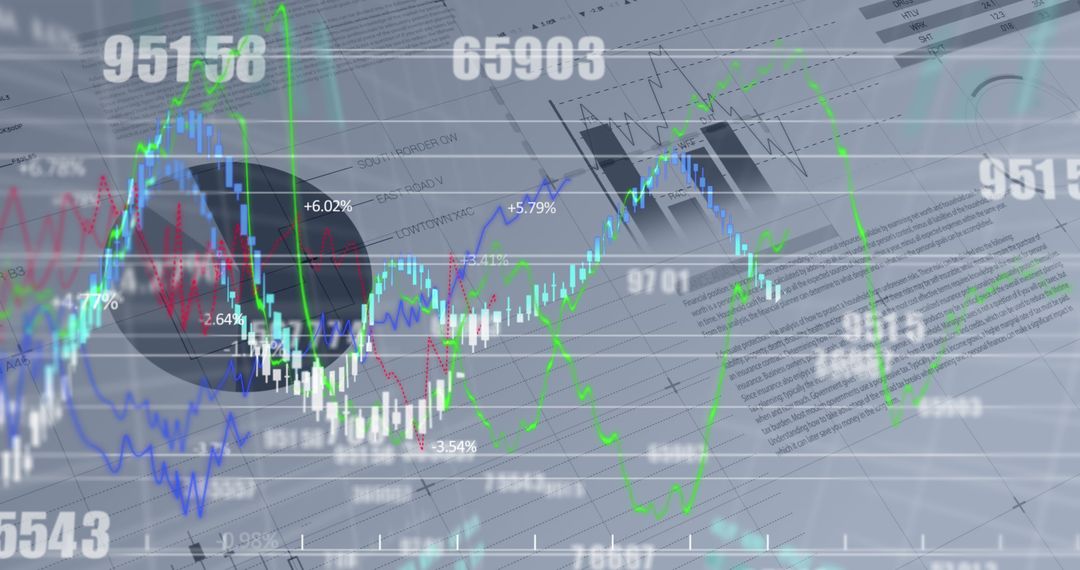
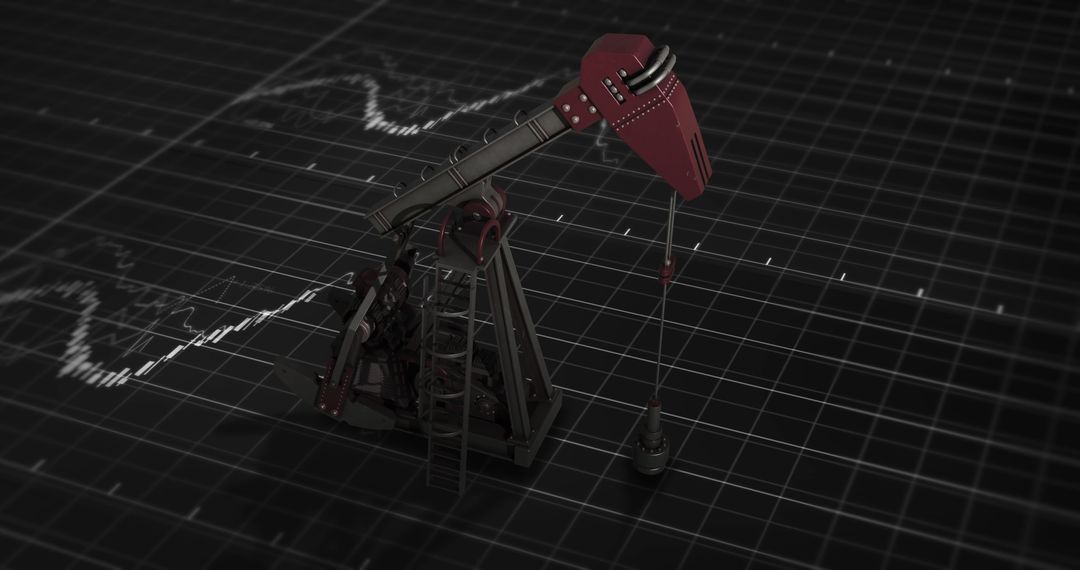
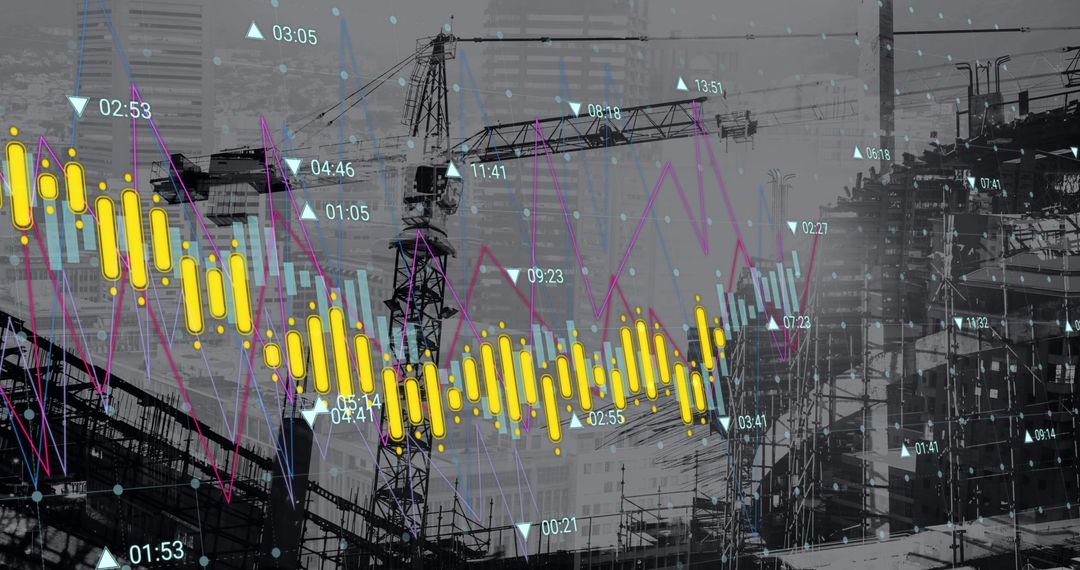
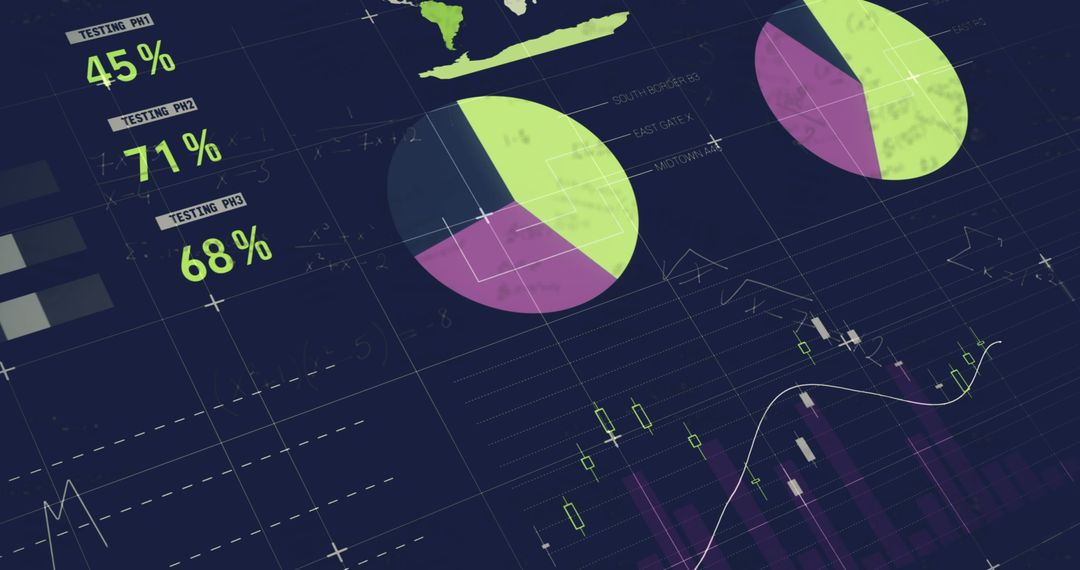
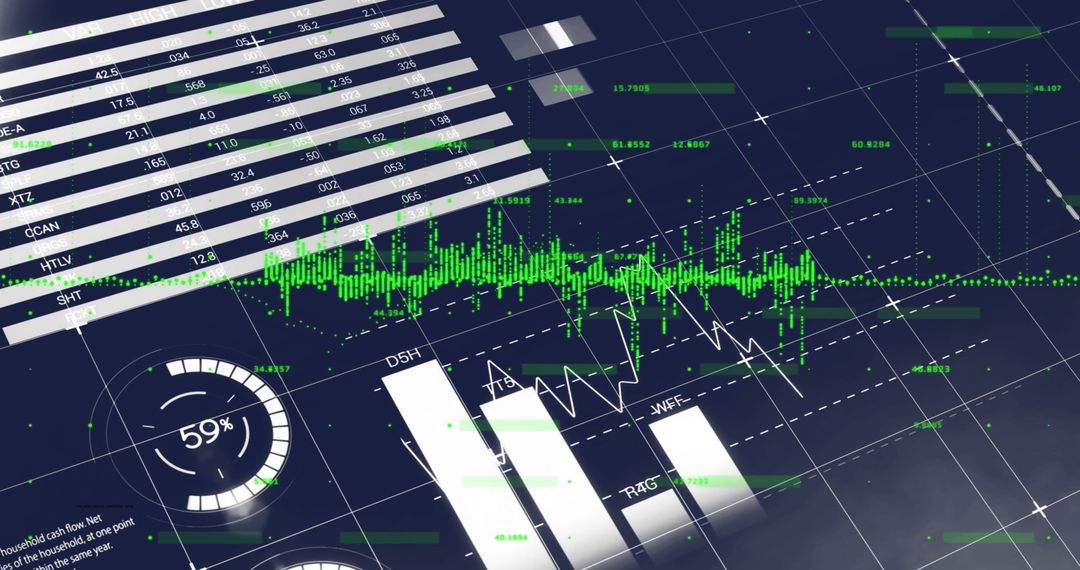
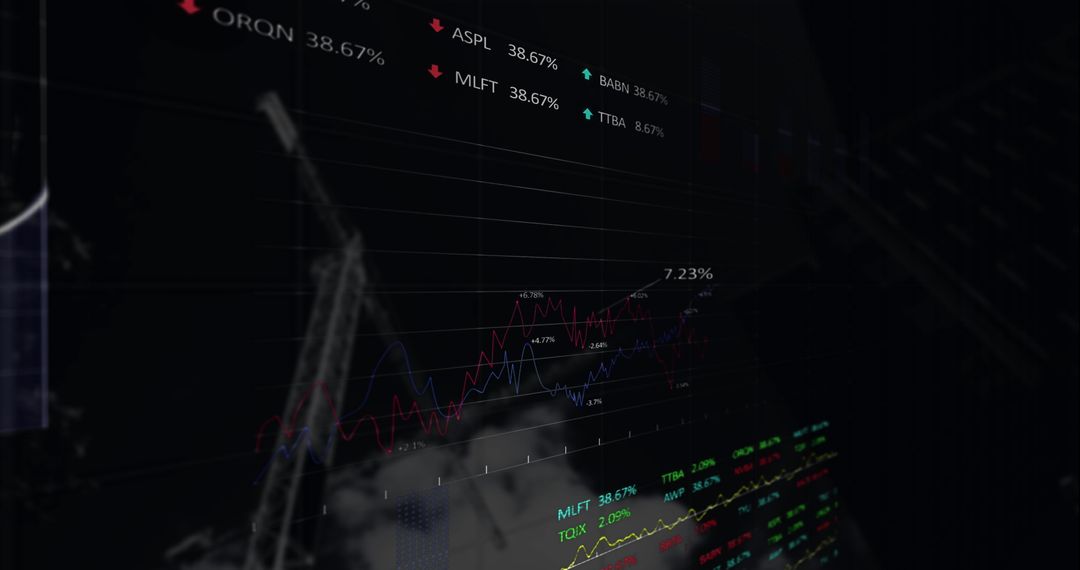
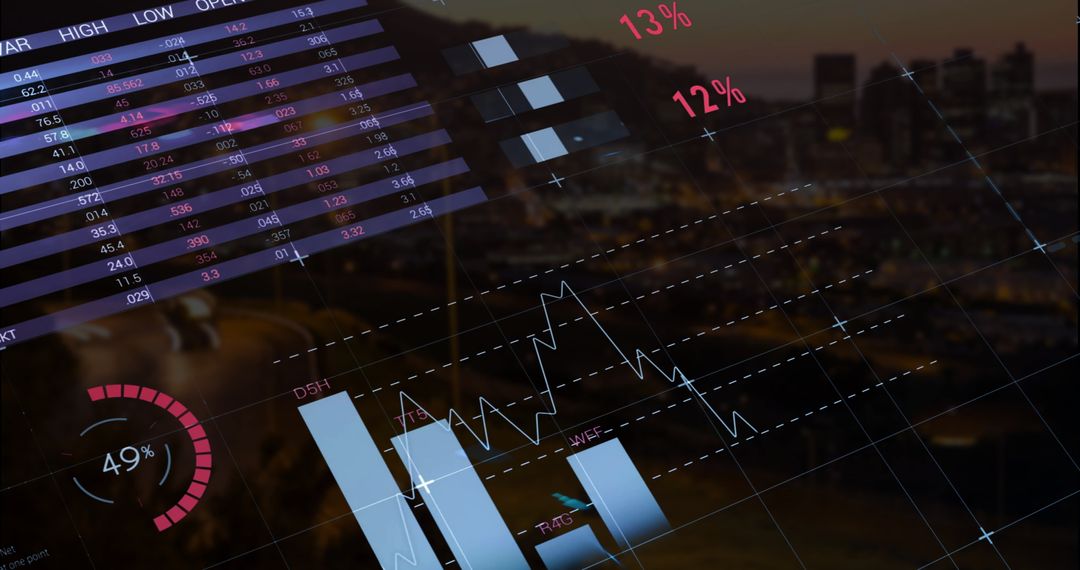
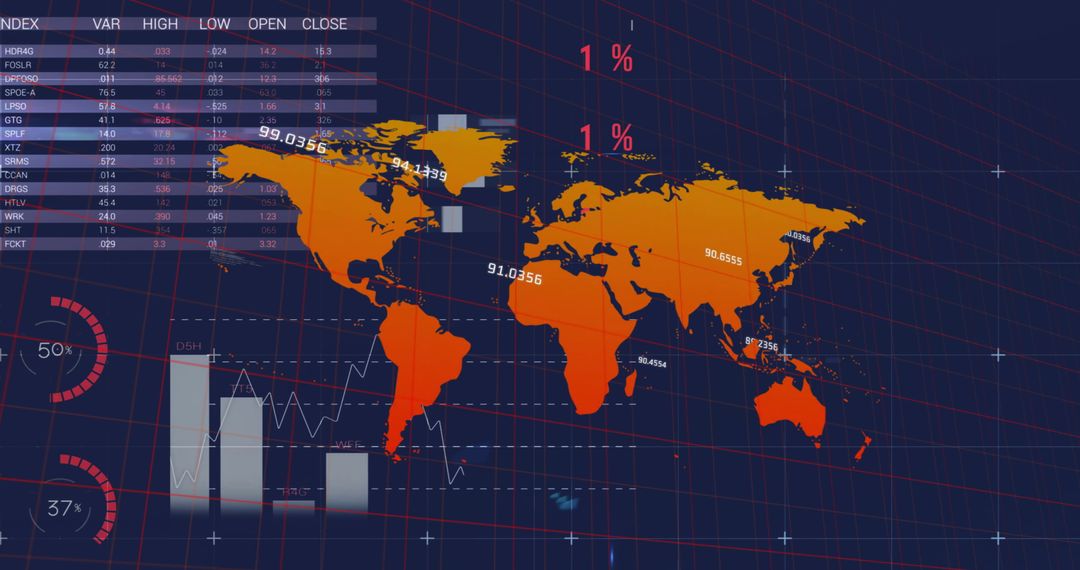
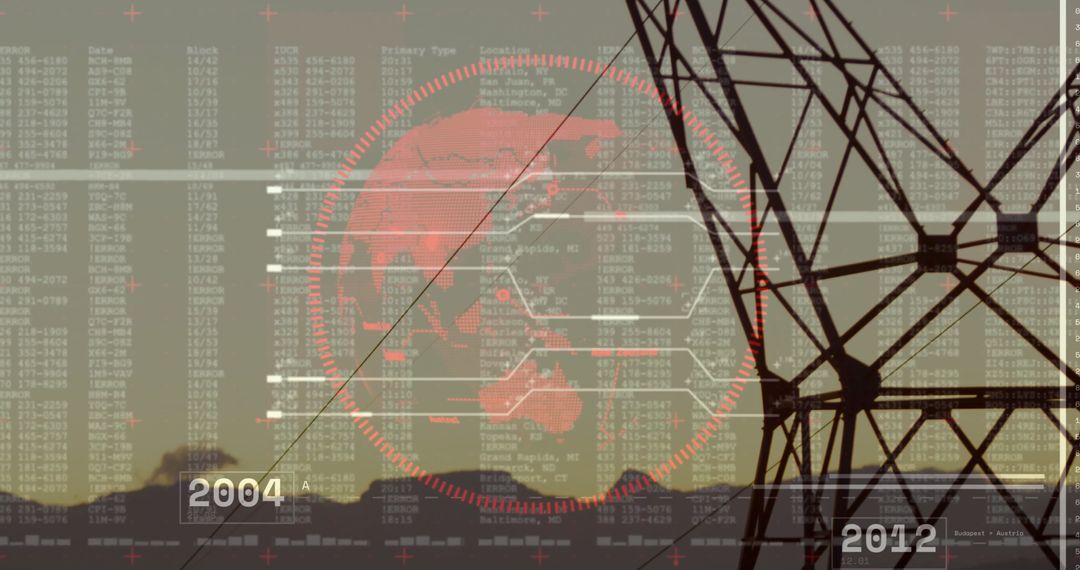
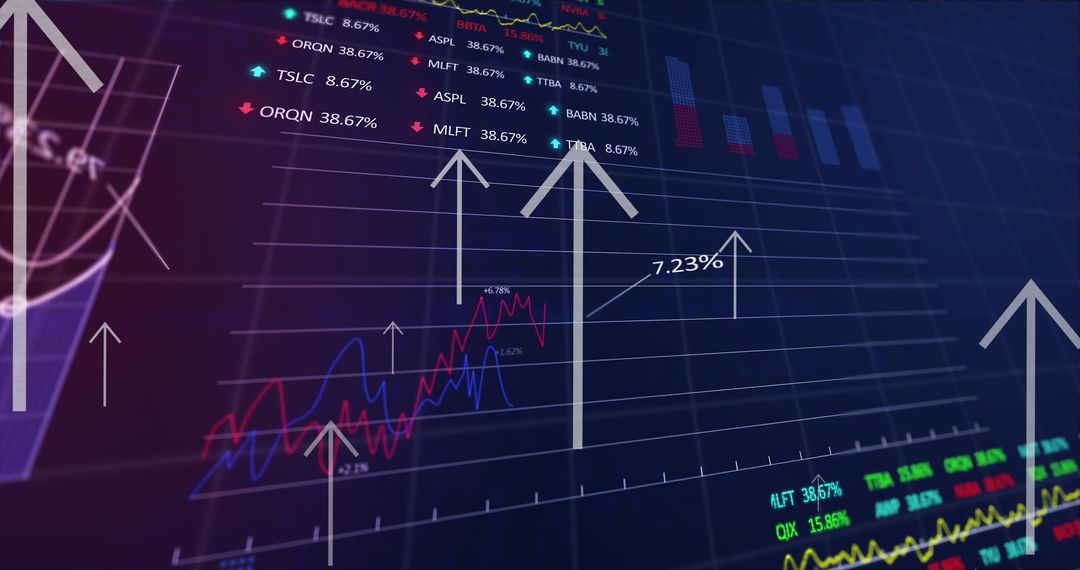
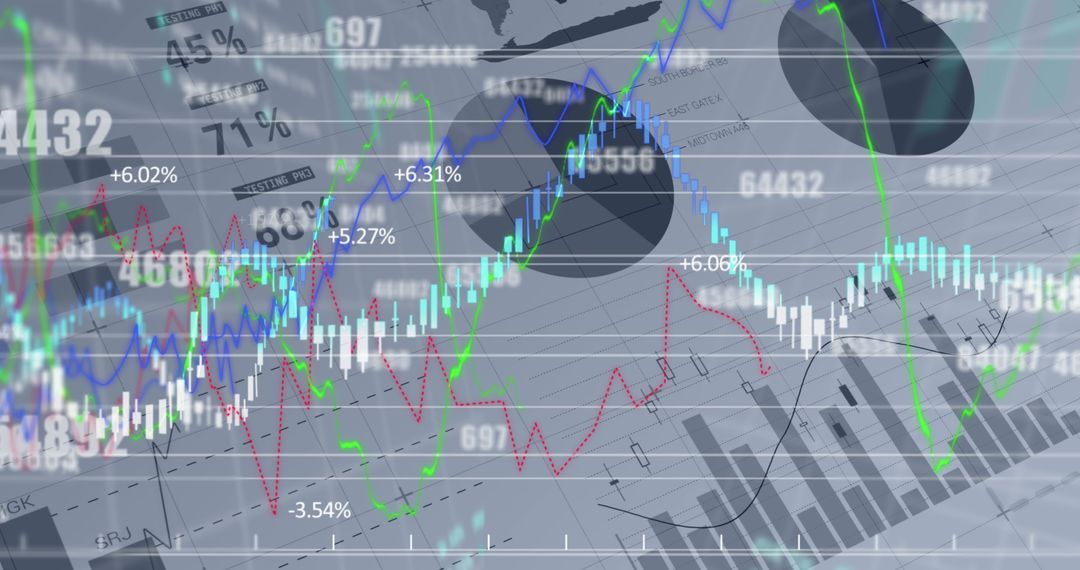
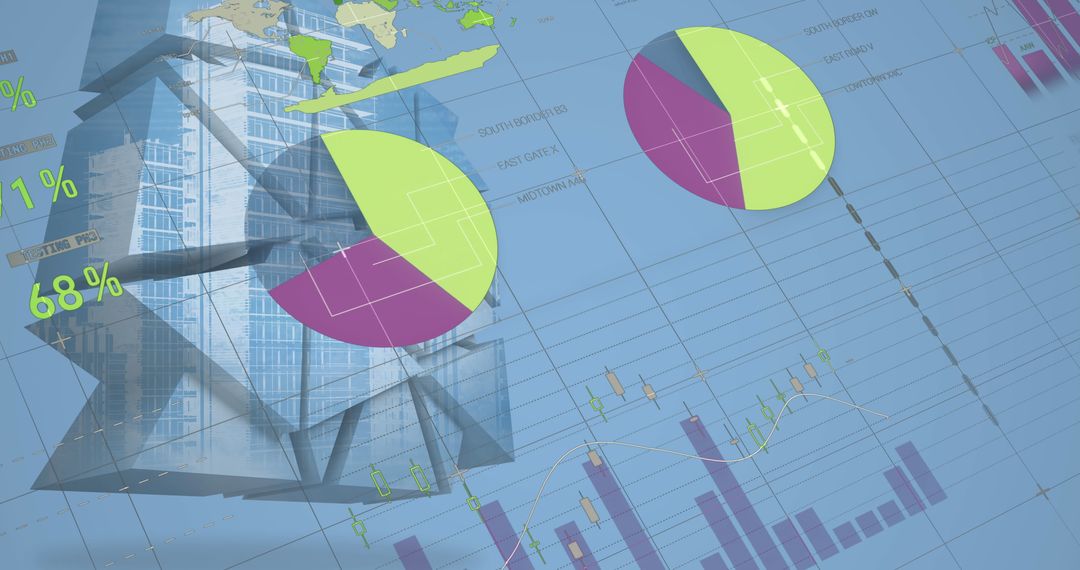
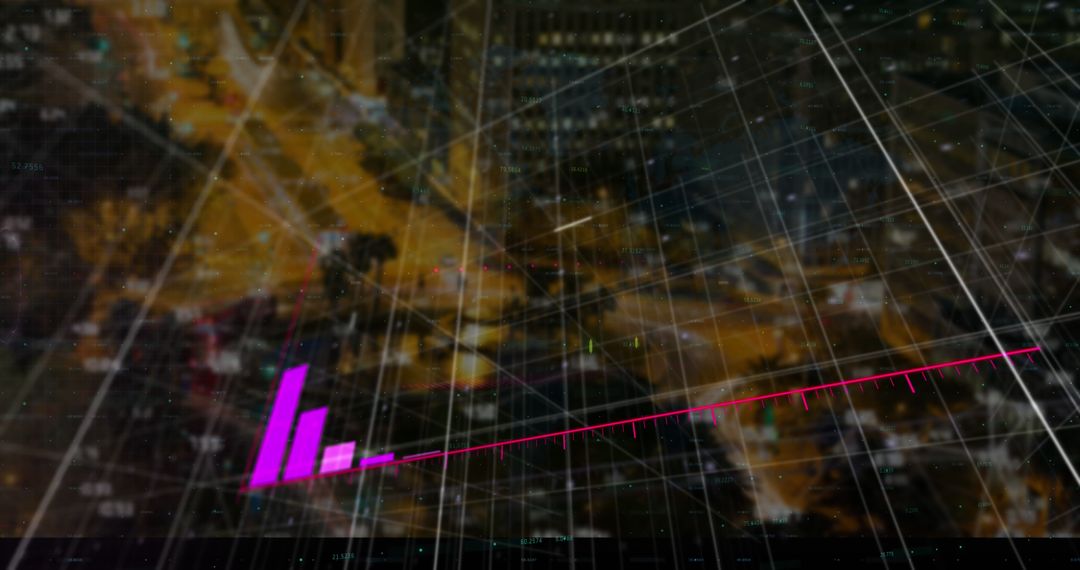
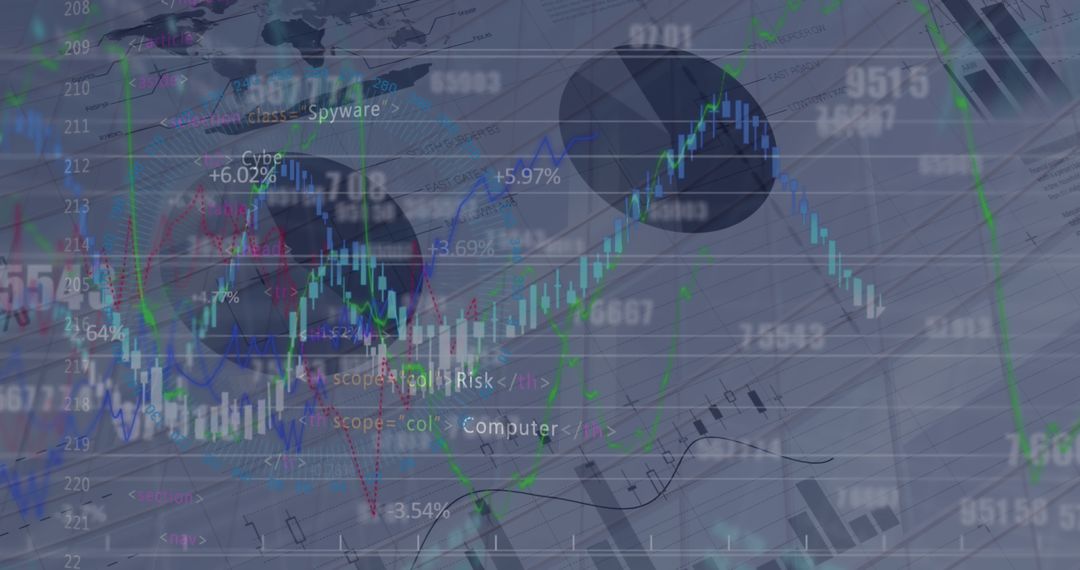
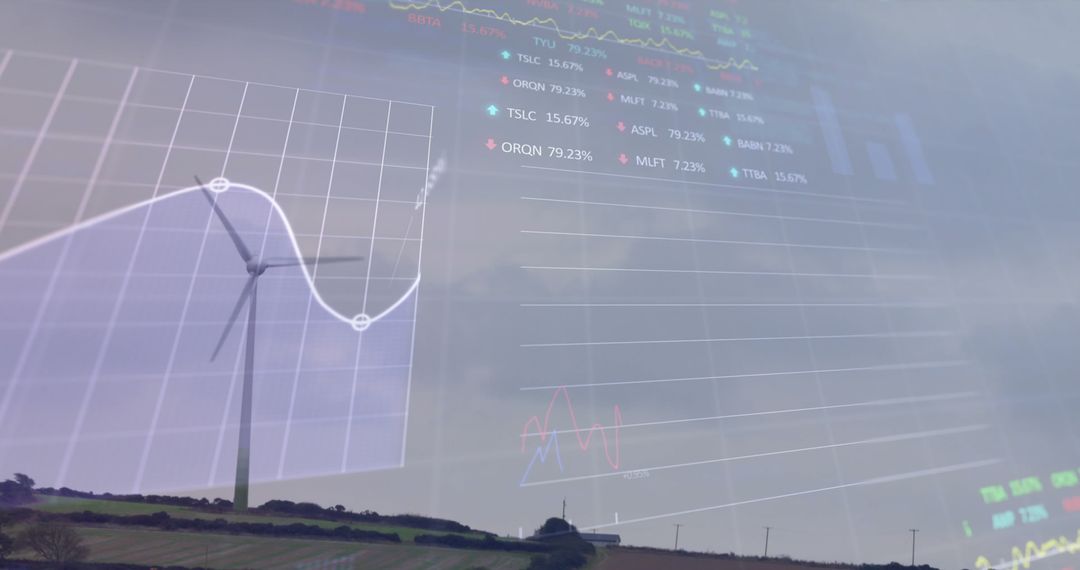
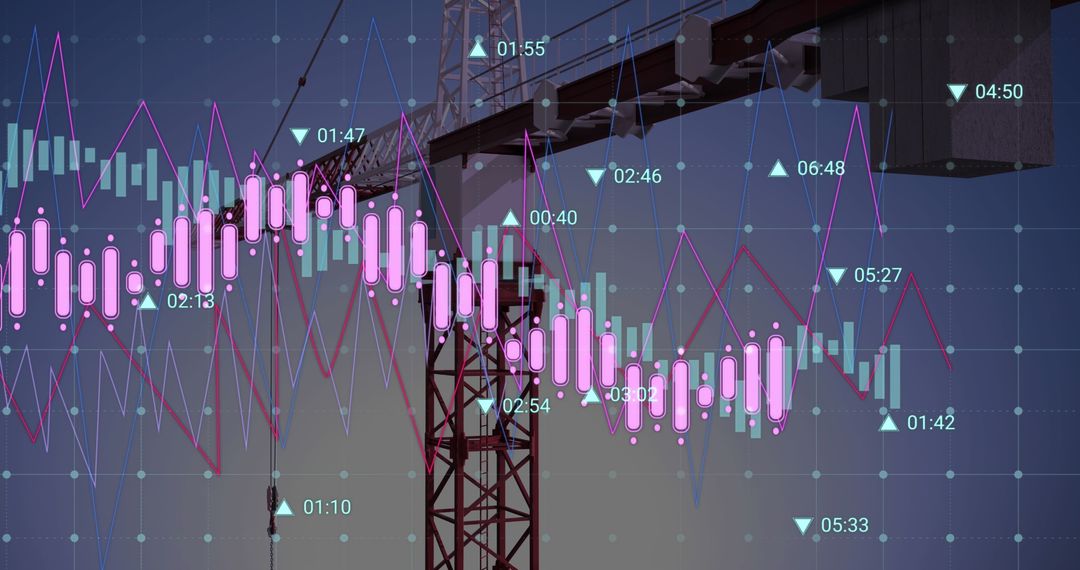
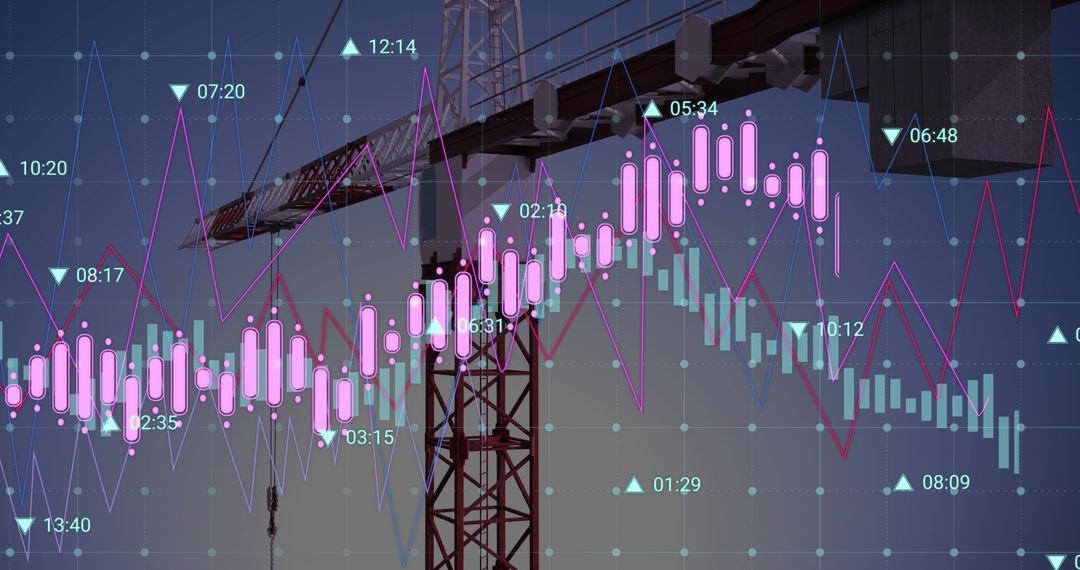
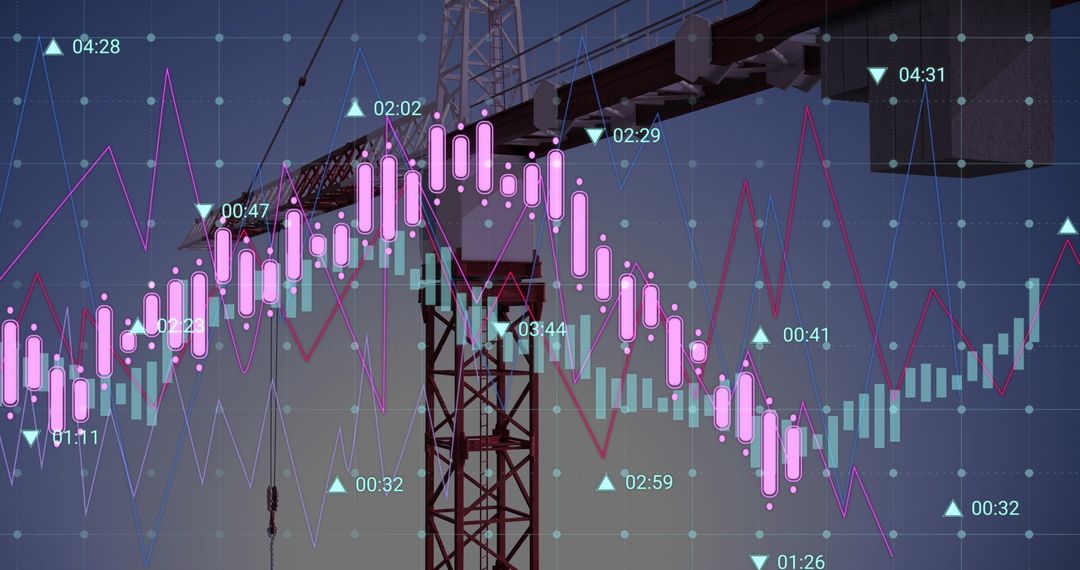
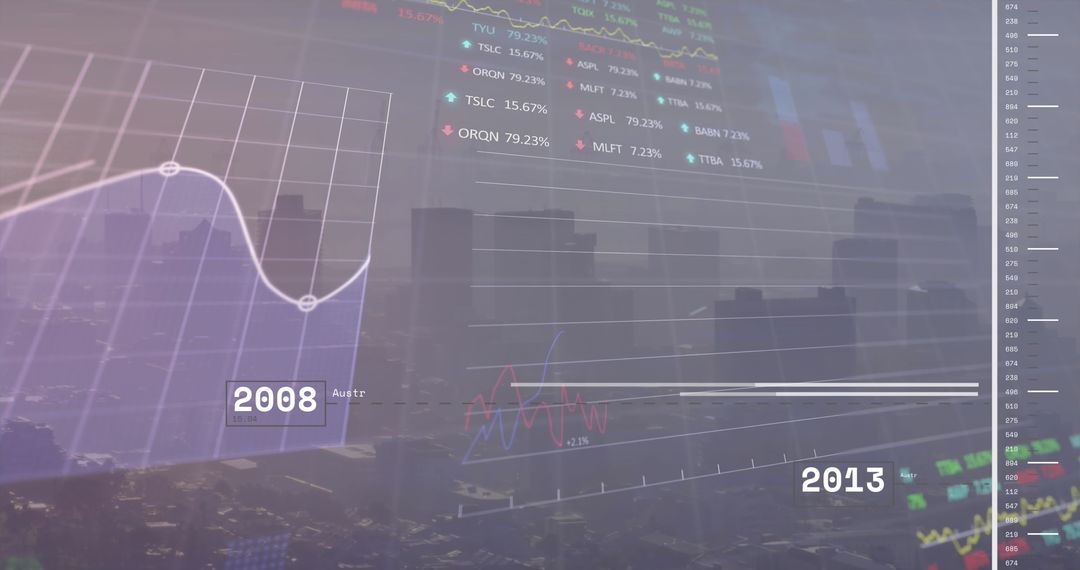
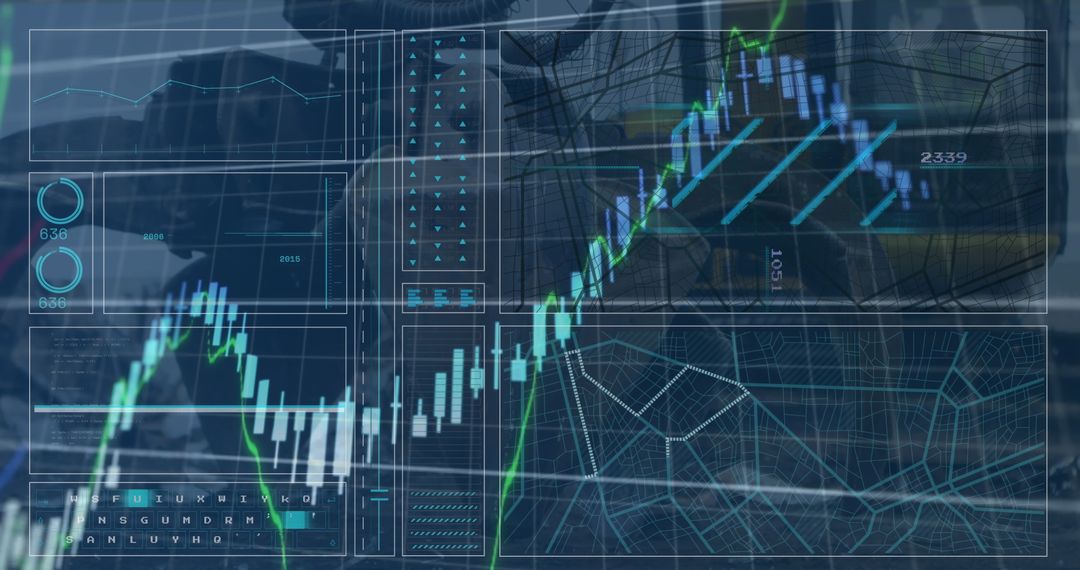
Visual features digital financial graphs intertwined with the image of an industrial machine, representing a fusion of industrial productivity and financial data analysis. Useful for concepts related to economic forecasting, market trends in the industrial sector, or discussions on the integration of technology and finance. Ideal for articles or presentations on financial automation and industry developments.

Powered by Adobe logo
Businessman reviewing quarterly financial report with tablet and graphs AI technology concept - Powered by AdobeRobot hand touching coin stack, symbolizing economic growth and technological advancement, showcasing financial progress and innovation - Powered by AdobeArtificial Intelligence AI technology for data analysis and business strategy development on digital dashboard, innovative machine learning solutions for financial investment, marketing, future growth - Powered by AdobeRobotic Hand Touching Rising Financial Graph Depicting Growth, Technology, Future, Investment, and Innovation Concepts - Powered by AdobeModern businessman analyzing data using advanced AI-powered automation technology on laptop - Powered by Adobe

Credit Photo

If you would like to credit the Photo, here are some ways you can do so

Free (free of charge)

Free for personal and commercial use.

Author: Awesome Content

Similar Free Stock Images

Excavator and Financial Charts in Urban Industrial Area
Premium
Charging bull made of golden stock market graphs, aggressive investment growth and bullish market energy.
Digital Financial Analytics Displayed on Abstract Background
Oil Pumpjack Analyzing Financial Market Trends
Financial Data Visualization with Interactive Graphs and Charts
Digital Data Footprint with 6G Network Technology Concept
Premium
Auto Market Dynamics: An abstract depiction of the automobile market, with a golden graph signifying market fluctuations. The background, a blurred array of automobiles, offers context to the dynamic.
Abstract Financial Data Processing Over Cityscape Background
Digital Stock Market Dashboard Over Cityscape
Oil Pump Jack and Financial Graphs Blend at Sunset
Dynamic Financial Data on Digital Interface Screen
Premium
Mechanical arm rests on graph paper depicting financial trends, creating visual metaphor for market analysis and future investment
Abstract Financial Data Chart with Blue Background
Digital Financial Data Analytics with Graphs and Charts
Digital Data Analysis with Graphs and Analytics Tools
Infographic Interface Featuring Digital Tree and Financial Data Visualization
Premium
Isometric Icons Representing Key Concepts in Digital Transformation, Data Management, Cloud Computing, and Industrial Automation
Financial Data Analysis with Cybersecurity Overlay and Code Elements
Digital Financial Data and Analytics Interface on Red Background
Digital Data Processing and Network Visualization Concept
Analytical Graphs and Digital Global Finance Concept
Premium
Robotic Hand Pointing at Rising Investment Chart with Graphical Data Background for Business Concept
Digital Financial Chart with Stock Market Data and Analytics
Digital Financial Data Analysis with Graphic Charts
Global Data Visualization with Interactive Digital Interface
Digital Financial Data Analysis with Bar and Line Graphs
Premium
Charging bull made of golden stock market graphs, aggressive investment growth and bullish market energy.
Global Financial Data Processing with Graphs and Charts on Dark Background
Digital Data Processing with Business Interface Elements on White
Oil Pumpjack with Stock Market Data Reflecting Energy Sector Trends
Digital Connectivity and Technological Advances Spanning Years
Modern Technology Displaying Digital Graphs and Transmission Tower
Futuristic Data Analysis Dashboard with Graphs
Premium
Robotic Hand Presenting Productivity Improvement and Business Growth Opportunities in a Digital Environment
Oil Pump Jack with Financial Data Visualization
Digital Representation of Financial Analytics with Graphs and Charts
Global Business Analysis with Digital Overlay on Modern Building
Algerian Oil Industry: Economic Data and Energy Resources
Premium
Factory aerial view and statistical data concept
Financial Data Displayed Over Wind Turbine Background in Blue
Digital Visualization of Oil Industry with Graphs and Pump Jack
Algeria Oil Industry Decline with Flag and Financial Data
Digital Financial Data Over Construction Site Skyline
Premium
Artificial Intelligence Technology Integration with Business Growth and Financial Success in the Digital Era Concept
Digital Graphs Overlaying Urban Skyline and Clouds
Analyzing Global Finance Trends with High-Tech Data Visualization
Financial Data Overlay on Shipyard Crane Background
Digital Email Communication with Global Technology Network
Premium
Silver car in background with rising orange bar graph overlay. Represents auto industry growth, market data analysis, financial trends, economic success. Digital grid lines suggest tech integration.
Dynamic Financial Data Analysis with Arrows
Futuristic Digital Dashboard with Financial Data Analysis
Digital Data Visualization of Global Statistics and Trends
Digital Charts Highlighting Global Finance Data Insights
Premium
Shiny metallic gears working together on machinery with blurred stock market graph and office background symbolizing industrial efficiency and economic growth
Digital Interface with Graphs and Data Overlaid on Building
Drone with Box Overlays Economic Data at Shipping Port
Futuristic Financial Data Analysis with Charts and Graphs
Analyzing Global Financial Data Visualization
Premium
Advanced robot analyzing financial data in futuristic setting
Global Economic Trends Imposed on Oil Industry Machinery
Futuristic Oil Pumping Machine with Data Graphs on Black Background
Transmission Tower with Futuristic Overlay Illustrating Digital Infrastructure
Dynamic Financial Data and Graph Arrows in Digital Interface
Dynamic Financial Charts and Data for Market Analysis
Oil Pump Extracting with Digital Financial Chart in Background
Premium
A futuristic robot hand reaches out to touch a digital interface displaying data visualizations. The scene represents advancements in technology and automation systems in modern industry. Scalp
Monochromatic Financial Data and Chart Analysis
Business Metrics Overlay on Modern Architecture Canvas
Algeria Financial Data with Oil Industry Background
Advanced Data Interface with Stock Market Analytics Graphics
Premium
Gear with financial graph reflection
Oil Extraction and Economic Graphs Over Sunset Background
Algeria Oil Industry and Finance Illustration with National Flag
Financial Data Overlay on Urban Construction Site
Construction Site with Financial Data Overlay and Digital Interface
Premium
A robotic arm pointing at stock market data on a computer screen
Digital Finance Analytics Interface with Transparent Cityscape Background
Financial Data Processing with Graphical Analysis Interface
Global Financial Data Processing with Networking Symbols
Dynamic Global Financial Data Overlaying Cityscape
Premium
Golden Gears and Graphs Displaying Economic Growth with Abstract Elements and Data Visualization on a Black Background
City Skyline Overlaid on Financial Growth Charts
Digital Interface with Mathematical Equations and Pie Charts
Oil Extraction Industry and Global Connection with Chinese Flag
Digital Fintech Visualization with Graphs and Data Icons
Premium
Two robotic hands shaking, representing artificial intelligence and human machine interaction in business, technology, and futuristic concepts, with a stock market graph visible in the background
Digital Financial Data Analysis with Graphs and Noble Tone
Digital Financial Data with Crane Silhouette in Background
Digital Financial Data Analytics and Cityscape Technology Integration
Digital World Map with Global Financial Data Visualization
Premium
A human and robot engage in a handshake, representing collaboration in a modern office. This image captures the essence of technology working alongside people effectively.Noogenesis
Futuristic Digital Landscape with Technology Infrastructure
Oil Pump Jack on Digital Financial Chart Background
Rising Financial Data with Arrows and Graphs
Analyzing Global Finance with Graphical Data
Oil Pump Overlaid on Financial Data Graphs
Oil Pumping Machine with Stock Market Graph Overlay
Premium
Financial data processing through advanced analytics in a modern office setting with digital interfaces, financial data processing over diverse business people in office
Infographic of Global Business Statistics Over Modern Building
Digital Data Processing and Cityscape Overlay Background
Global Data Processing and Analysis in Digital Interface
Wind Turbines Against Financial Graph Skyscraper Environment
Premium
Robotic hands point at glowing upward trend arrow on financial graph, symbolizing economic growth and AI innovation
Construction Site with Financial Data Overlay and Built-in Technology Concept
Financial Data Overlay on Construction Site with Crane
Crane and Stock Market Graph for Business Growth Concept
Digital Financial Data with Business Charts Revealing Economic Trends
Premium
A robotic hand interacts with digital financial charts on multiple screens. The scene illustrates advanced technology in finance and data analysis.
Financial Data Overlaid on Recycling Junkyard Scene
Futuristic Data Processing and Global Network Interface Display
High Tech Financial Data Visualization with Analytics
Futuristic Digital Infographic Superimposed on Cityscape
Premium
Businessman reviewing quarterly financial report with tablet and graphs AI technology concept
Digital Interface with Financial and Statistical Data Visualizations
Abstract Financial Data and Stock Market Analysis Background
Digital Financial Data Processing Displayed on Blue Background
Digital Data Processing with Finance Analytics: Global Business Concept
Premium
Blue arrow showing upward growth in car showroom. Business chart with rising trend for vehicle sale or automotive industry success. Financial graph.
Dynamic Data Analytics with Graphs and Charts
Digital Financial Interface Overlaying Modern Urban Cityscape
Business Graph Analysis on Office Desk with Stationery
Financial Analysis Overlay on Industrial Pumpjack Graphics
Premium
Manager points at digital dashboard with graphs. Person analyzes data on screen. Supply chain expert uses analytics for inventory planning. Future tech in logistics operations.
Pumpjack with stock market charts overlay conveying oil energy sector financial analytics