
- Home >
- Stock Photos >
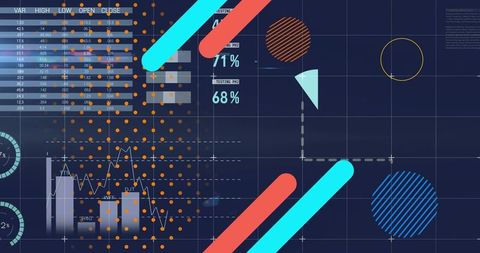
- Interactive Financial Line Chart on Digital Interface
Interactive Financial Line Chart on Digital Interface Image

Visual representation of fluctuating stock market data displayed on a digital interface. Ideal for use in presentations about financial analytics, data trends, and investment strategies. Suitable for blogs and articles discussing technology in finance, market forecasting, or interactive data visualization tools.
Powered by 


downloads
Tags:
More
Credit Photo
If you would like to credit the Photo, here are some ways you can do so
Text Link
photo Link
<span class="text-link">
<span>
<a target="_blank" href=https://pikwizard.com/photo/interactive-financial-line-chart-on-digital-interface/b6789f1f758b1fd2fff37a7189013365/>PikWizard</a>
</span>
</span>
<span class="image-link">
<span
style="margin: 0 0 20px 0; display: inline-block; vertical-align: middle; width: 100%;"
>
<a
target="_blank"
href="https://pikwizard.com/photo/interactive-financial-line-chart-on-digital-interface/b6789f1f758b1fd2fff37a7189013365/"
style="text-decoration: none; font-size: 10px; margin: 0;"
>
<img src="https://pikwizard.com/pw/medium/b6789f1f758b1fd2fff37a7189013365.jpg" style="margin: 0; width: 100%;" alt="" />
<p style="font-size: 12px; margin: 0;">PikWizard</p>
</a>
</span>
</span>
Free (free of charge)
Free for personal and commercial use.
Author: People Creations
Similar Free Stock Images

Premium


Premium


Premium


Premium


Premium


Premium

Premium


Premium


Premium


Premium


Premium


Premium


Premium

Premium


Premium


Premium


Premium


Premium

Premium


Premium

Premium


Premium


Premium


Premium


Premium


Explore More Free Stock Images