- Home >
- Stock Photos >
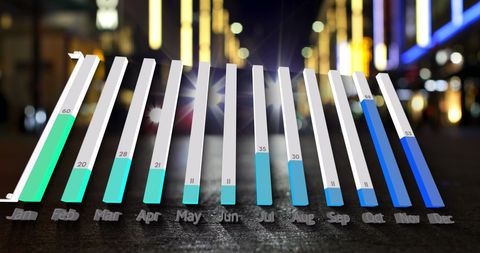
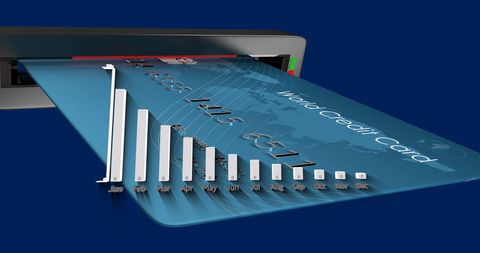
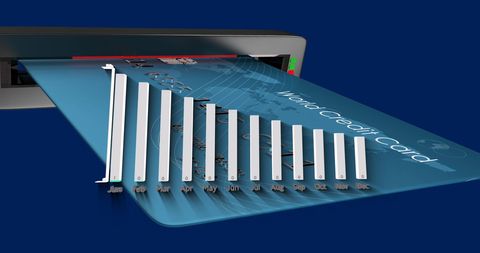
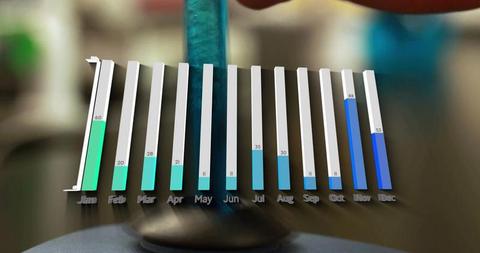
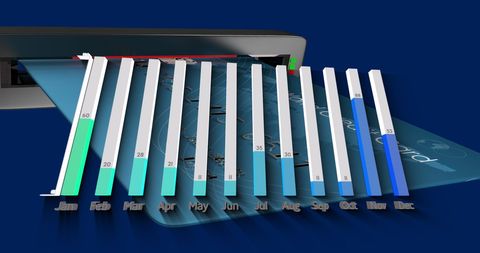
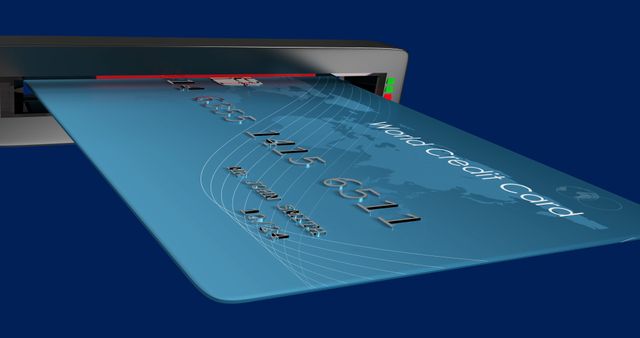
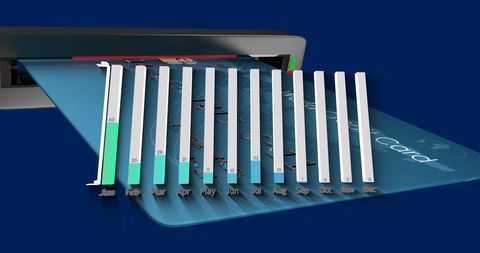
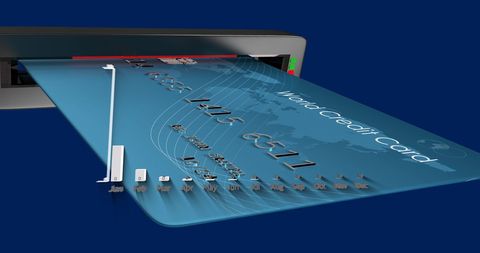
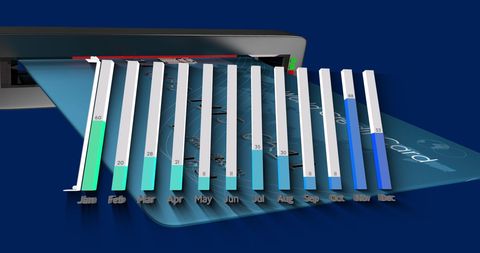
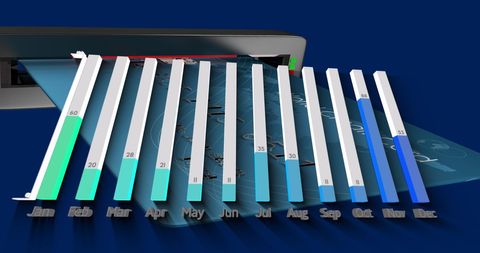
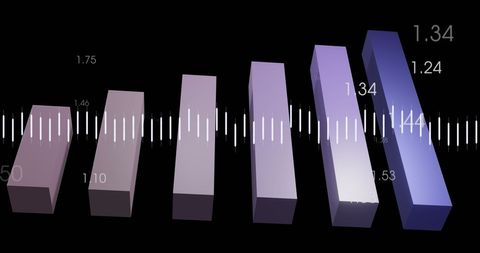
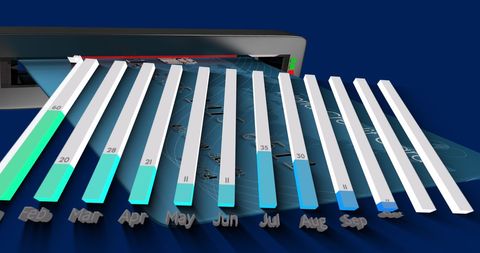
- Interactive Graphs Demonstrating Technology Concepts
Interactive Graphs Demonstrating Technology Concepts Image

Dynamic 3D illustration highlighting overlay of interactive graphs over text, representing complex data visualization and advanced technology ideas. Useful for presentations related to data analytics, business innovations, tech industry advancements, or educational content on data interpretation. The graphic's futuristic aspect amplifies themes around digital transformation and strategic growth analysis.

downloads
Tags:
Credit Photo
If you would like to credit the Photo, here are some ways you can do so
Text Link
photo Link
<span class="text-link">
<span>
<a target="_blank" href=https://pikwizard.com/photo/interactive-graphs-demonstrating-technology-concepts/7913d55caa00bb1f57cf3ef7d7832d17/>PikWizard</a>
</span>
</span>
<span class="image-link">
<span
style="margin: 0 0 20px 0; display: inline-block; vertical-align: middle; width: 100%;"
>
<a
target="_blank"
href="https://pikwizard.com/photo/interactive-graphs-demonstrating-technology-concepts/7913d55caa00bb1f57cf3ef7d7832d17/"
style="text-decoration: none; font-size: 10px; margin: 0;"
>
<img src="https://pikwizard.com/pw/medium/7913d55caa00bb1f57cf3ef7d7832d17.jpg" style="margin: 0; width: 100%;" alt="" />
<p style="font-size: 12px; margin: 0;">PikWizard</p>
</a>
</span>
</span>
Free (free of charge)
Free for personal and commercial use.
Author: People Creations