1. Home > 
  2. Stock Photos > 
  3. Interactive Green Line Chart on Analytics Dashboard Interface

Interactive Green Line Chart on Analytics Dashboard Interface Image

Interactive Green Line Chart on Analytics Dashboard Interface

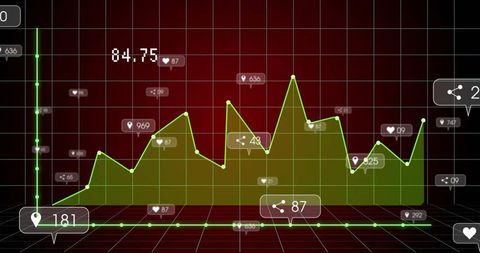
This visualization displays an interactive green line chart on a digital analytics dashboard, surrounded by various metric icons including heart and sharing symbols. The grid background and glowing red-to-green color palette create a modern, technological appearance. Ideal for presentations on data analysis, tech conferences, illustrating growth or decrease in metrics, or emphasizing real-time analytics in technological solutions.

Powered by Shutterstock logo - Get 15% off with code: PIKWIZARD15
Businessman analysing trading  up trend line graph in bull market, Digital analytics data visualization, financial schedule Currency and Exchange Stock Chart for Finance and Economy Display - Powered by Shutterstock - Get 15% off with code: PIKWIZARD15Displaying line chart fluctuating on market terminal, with green bars, percentages and grid overlay. Analytics, data visualization, finance, technology, digital interface, investment, performance - Powered by Shutterstock - Get 15% off with code: PIKWIZARD15Displaying finance interface showing tickers with percentages and green line graphs in trading room. Technology, data visualization, financial analysis, digital dashboard, corporate, modern, - Powered by Shutterstock - Get 15% off with code: PIKWIZARD15Scanning business-casual IT tech holding phone, viewing AR charts amid server racks, copy space. Technology, data, visualization, innovation, analytics, futuristic, professional - Powered by Shutterstock - Get 15% off with code: PIKWIZARD15Displaying blueprint grid over laptop silhouette, showing green line chart with axis scale markings. Financial analytics, data visualization, technology, digital industry, corporate, professional - Powered by Shutterstock - Get 15% off with code: PIKWIZARD15

Credit Photo

If you would like to credit the Photo, here are some ways you can do so

Free (free of charge)

Free for personal and commercial use.

Author: People Creations

Similar Free Stock Images

Dynamic Digital Finance Chart with Green Line on Grid
Premium
Showing shirtless man modeling in studio, displaying line charts with data floating over axes. Financial, analytics, data, visualization, trend, market, performance
Financial Data Graph Rendering Global Market Trends
Fluctuating Financial Graph with Red Line on Green Grid
Falling Line Graph on Navy Background Illustrating Economic Decline
Futuristic Global Business Data with Digital Interface
Premium
Pointing man in workwear holding marker, cup at office glass wall with sticky notes, green overlay. Collaboration, teamwork, brainstorming, ideation, analytics, data, visualization
Dynamic Data Graphs on Digital Interface Background
Dynamic Financial Charts and Graphs Indicating Market Trends
Digital Financial Data Graph Showcasing Market Trends
Dynamic Financial Data Visualizations on Grid Interface
Premium
Financial chart displaying bars and colored lines on grid with numerical labels and up or down arrows. Technology, analytics, data visualization, dashboards, finance, innovation, digital
Dynamic Financial Data Visualization on Digital Grid Background
Digital Graph with Rising and Falling Lines on Grid Background
Futuristic Financial Data Analysis with Rising White Line Graph
Digital Financial Graphs Over 3D City Model Illustration
Premium
Displaying hexagon icon cluster centered on dark panel showing JavaScript code and numeric labels. Dashboard, analytics, data, visualization, neon, gradient, grid
Dynamic Financial Data Overlaid on Grid Background
Financial Data with Molecular Background Concept
Digital Stock Market Graph Red Trendline on Green Background
Digital Green Line Graph Over Grid with Statistics and Numbers
Premium
Displaying 3D bar graph with numeric labels and line chart over lake with forest, hills, analytics. Data, visualization, natural landscape, mountainous, infographic, ecosystem, analytics
Futuristic Growth Hacking Data Analytics Concept
Futuristic Data Visualization Graph Vector Rising Trend
Dynamic Analytics Chart with Colored Area Segments and Data Values
Advanced Digital Dashboard with Rising Bar and Line Charts
Premium
Displaying digital world map overlaying dark-grid interface, with neon line charts and data markers. Technology, analytics, data visualization, finance, digital interface, charting, cybersecurity
Financial Analysis Concept with Modern Chart Display
Social Media Growth Metrics on Digital Dashboard Grid
Red Line Graph Displaying Complex Digital Trend Analysis
Financial Growth Illustrated with Bar Charts and Upward Arrow
Abstract Finance Graph Over 3D Cityscape Background
Financial Data Visualization Over Futuristic Cityscape
Premium
Displaying green line chart trending upward on financial dashboard with numeric and code overlays. Technology, analytics, data, visualization, digital, finance, innovation
Dynamic Financial Graph Over Red Background
Rising Digital Graph and Data Visualizations on Black Background
Futuristic Data Processing Animation with Media Icons
Digital Financial Data with Graph and Grid Patterns
Premium
Displaying bright green line graph with numeric labels on blueprint grid overlaying book silhouette. Analytics, data, visualization, technology, finance, dashboard, innovation
Dynamic Financial Growth Digital Chart Display
Data Analytics Graphs on Digital Interface Background
Dynamic Business Data and Cityscape Visualization
Abstract Data Visualization with Dynamic Charts and Graphs
Premium
Displaying numeric chart in trading interface, with candlestick, bar, line, pie and arrow elements. Analytics, data visualization, finance, digital interface, investment, market analysis, economic
Data Visualization on Security Shield Interface for Cyber Security
Financial Data Graph Over Cityscape with Digital Overlay
Data Analysis Graphics on Digital Grid Background
Interactive Social Media Metrics Overlaid on Business Data Graph
Premium
Displaying red line chart arrow trending downward over rocky forest river, with translucent grid. Nature, landscape, topography, analytics, data visualization, environment, tranquility
Dynamic Stock Market Chart with Fluctuating Trends and Data Points
Futuristic Digital Graph Showing Data Trends on Analytic Interface
Digital Data Processing with Chart in Futuristic Interface
Advanced Financial Charting with Zigzag Indicator and Trends
Premium
Gazing man wearing fabric face mask and round glasses in blurred office, with digital overlays. Futuristic, technology, analytics, data visualization, innovation, professional, digital
Green Line Chart on Digital Interface with Data Display
Green Graph with Thumbs-Up Notifications Symbolizing Positive Data Trends
Futuristic Data Visualization with Dynamic Graphs and Digital Globe
Futuristic Neon Green Graph with Data Alerts
Premium
Overlaying aerial coastal view with yellow and green line graphs, bar charts, numbers on blue grid. Landscape, finance, analytics, data visualization, technology, coastline, agriculture
Modern Financial Analysis Display with Dynamic Bar and Line Graphs
Fluctuating Line Chart on Analytics Dashboard Interface
Displaying pixelated user profile overlaying blue and red trend lines on analytics panel
Digital Finance Analytics with Stock Market Data
Financial Data Overlay on Cityscape Visualizing Market Trends
Financial Data Flow against Urban Skyline Backdrop
Premium
Displaying bars and green line plotting values on grid dashboard interface, arrow, numeric labels. Analytics, data, visualization, dashboard, growth, innovation, finance
Data Analytics and Financial Growth Indicators
Digital Finance: Modern Stock Market Analysis Display
Dynamic Stock Market Graph Displaying Surging Growth
Digital Concept of Stagflation with Chart and Globe Illustration
Premium
Typing woman in white shirt on silver laptop at wooden desk with pad, candlestick blue-line overlay. Finance, analytics, data, visualization, dashboard, computer, focus
Abstract Digital Finance Chart Showing Fluctuating Graph Lines
Digital Finance Chart Overlaying Globe Background
Rising Graph Line on Digital Green Grid Background
Abstract Digital Charts with Social Media Metrics Rising
Premium
Data analyst in striped polo leaning toward bar chart on grid, with 3D-rendered bars, copy space. Analytics, data visualization, financial, futuristic, professional, digital, insights
Dynamic Financial Graph with Rising Stock Data
Analyzing Financial Data on Digital World Map Background
Cityscape with Digital Stock Market Graphs and Statistics
Fluctuating Financial Graph on Green Grid Background
Premium
Resting green lettuce on white backdrop, with grid, cyan bars, line graphs and purple time markers. Freshness, health, organic, digital analytics, data visualization, innovation, technology
Digital Visualization of Global Networking with Statistical Graphs
Futuristic Data Dashboard with Abstract Waveforms and Light Effects
Data Visualization with Graph and Globe for Business Analytics
Dynamic 3D Renewable Energy and Finance Data Analysis
Premium
Showcasing wooden bowl of salad with grilled chicken, showing stock chart overlay in kitchen. Fresh produce, healthy eating, business analytics, data visualization, nutritious meal, digital interface
Futuristic Global Network with Pulsing ECG Line and Hexagonal Overlays
Dynamic Social Media Analytics with Zigzag Chart on Grid Background
Futuristic Neon Green Data Visualization on Grid Background
Futuristic Data Visualization with Social Media Elements
Premium
Showing dashboard above woman wearing blazer checking tablet at office with charts, copy space. Analytics, data visualization, fintech, technology, investment, professional, innovation
Interactive Digital Analytics Dashboard for Real-Time Data Tracking
Tracking neon-cyan analytics dashboard showing social engagement peaks with 5760 likes tooltip
Dynamic Blockchain Data Chart with Financial Trends Background
Digital Financial Data Overlaying City Skyline at Dusk
Data Recovery Progress Display on Digital Interface
Dynamic Line Chart with Histogram on Digital Grid Background
Premium
Baby in purple shirt and woman reviewing charts in conference room, with green line chart overlay. Professional, business, analytics, data visualization, teamwork, modern, corporate
Fluctuating Digital Stock Market Data Chart
Financial Graph Analysis on Green Grid Background
Data Trends and Analysis on 3D Digital Grid
European Market Data Overlay with EU Flag and Financial Graphs
Premium
Sketching notes with ballpoint pen on paper sheets at wood desk, with digital candlestick chart. Professional, analytics, data, visualization, finance, business, strategy
Digital Data Visualization with Trend Lines and Percentage Changes
Rising Financial Data Graph on Digital Grid Background
Dynamic Green Line Graph Depicting Financial Data
Dynamic Stock Market Chart with Time Indicators and Data Trends
Premium
Golfer wearing shorts lining up putt at white ball on green, with digital data overlay. Sports analytics, data visualization, golf technology, athletic performance, digital interface
Dynamic Financial Graphs Overlaying Modern Cityscape
Line Graph Illustrating Data Trend on Green Digital Background
Abstract Digital Data Graph and Diagrams on Gray Background
Financial Growth Stock Nikkei in Urban City Skyline
Premium
Showing wheat stalks in rural field, with green light blue yellow line graphs and numeric labels. Agrarian, analytics, data visualization, pastoral, growth, sustainable, natural
Interactive Digital Analytics Dashboard with Engagement Data
Red Zigzag Graph with Arrow on Green Grid Background
Woman Working on Laptop with Financial Data Graph Overlay
Futuristic Data Visualization 3D Graph with Neon Grid
Premium
Displaying financial chart on screen with blue candlesticks, red or green curves, yellow gridlines. Technology, analytics, data visualization, finance, investment, digital, futuristic
Dynamic Line Graph with Digital Engagement Metrics Simulation
Candlestick Chart Visualization with Indicators and Growth Highlight
Financial Growth Chart with Data Visualization Elements
Digital Finance Dashboard Showing Candlestick and Line Charts
Premium
Showing aerial scene at harbor featuring moored boats on docks with farmland and financial overlays. Marina, coastal, aerial, landscape, analytics, data, visualization
Glowing Neon Red Global Trend Line Chart Showing Market Fluctuations on Digital World Map