- Home >
- Stock Photos >
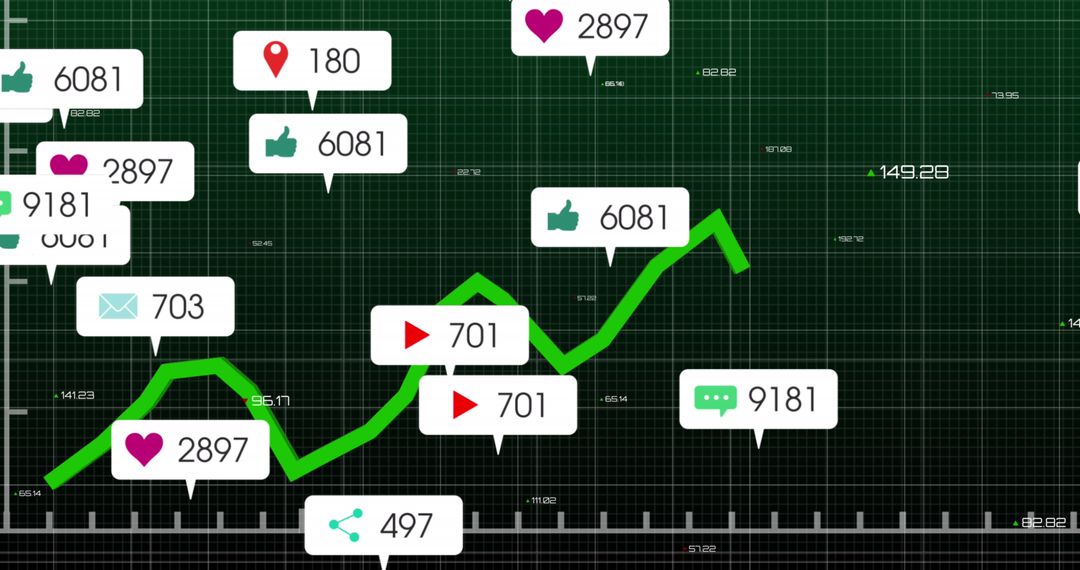
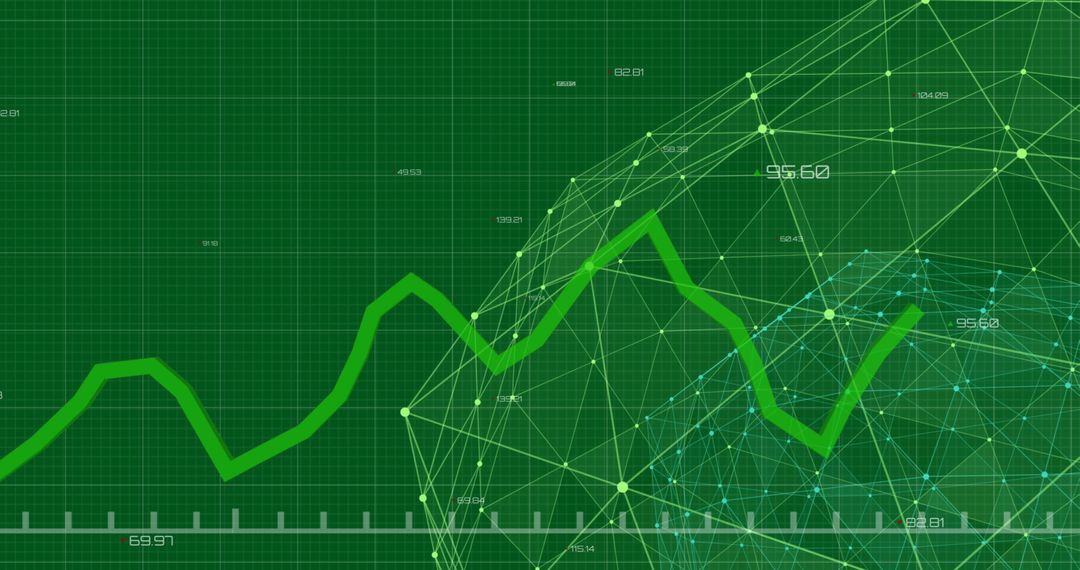
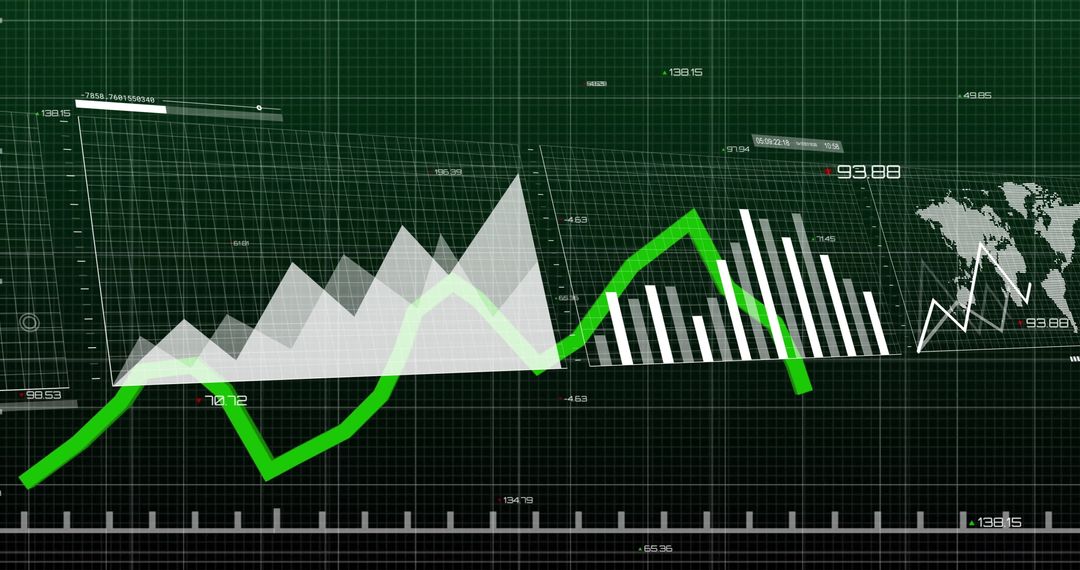
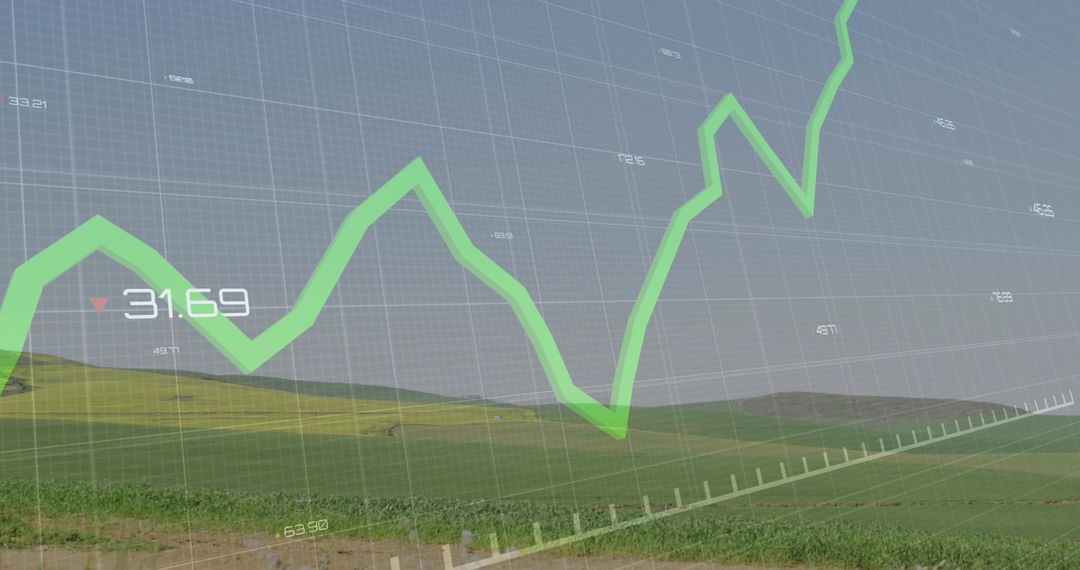
- Interactive Green Line Graph on Analytics Dashboard with Statistics
Interactive Green Line Graph on Analytics Dashboard with Statistics Image

Green line graph displayed on digital analytics dashboard, with interactive elements such as chat bubble and thumbs-up icons representing user engagement. Graph indicating upward and downward trends and patterns valuable for market analysis, business evaluations, digital data assessment. Useful for presentations, business reports, corporate blogs or websites focusing on rising and declining trends, key performance indicators, data-driven decisions.
Powered by  - Get 15% off with code: PIKWIZARD15


0
downloads
downloads
Tags:
More
Credit Photo
If you would like to credit the Photo, here are some ways you can do so
Text Link
photo Link
<span class="text-link">
<span>
<a target="_blank" href=https://pikwizard.com/photo/interactive-green-line-graph-on-analytics-dashboard-with-statistics/3fbe462f68413e8b7ae8147e139473fd/>PikWizard</a>
</span>
</span>
<span class="image-link">
<span
style="margin: 0 0 20px 0; display: inline-block; vertical-align: middle; width: 100%;"
>
<a
target="_blank"
href="https://pikwizard.com/photo/interactive-green-line-graph-on-analytics-dashboard-with-statistics/3fbe462f68413e8b7ae8147e139473fd/"
style="text-decoration: none; font-size: 10px; margin: 0;"
>
<img src="https://pikwizard.com/pw/medium/3fbe462f68413e8b7ae8147e139473fd.jpg" style="margin: 0; width: 100%;" alt="" />
<p style="font-size: 12px; margin: 0;">PikWizard</p>
</a>
</span>
</span>
Free (free of charge)
Free for personal and commercial use.
Author: Creative Art
Similar Free Stock Images

Premium


Premium


Premium


Premium


Premium


Premium


Premium


Premium


Premium


Premium


Premium


Premium


Premium


Premium


Premium


Premium


Premium


Premium


Premium


Premium


Premium


Premium


Premium


Premium