- Home >
- Stock Photos >
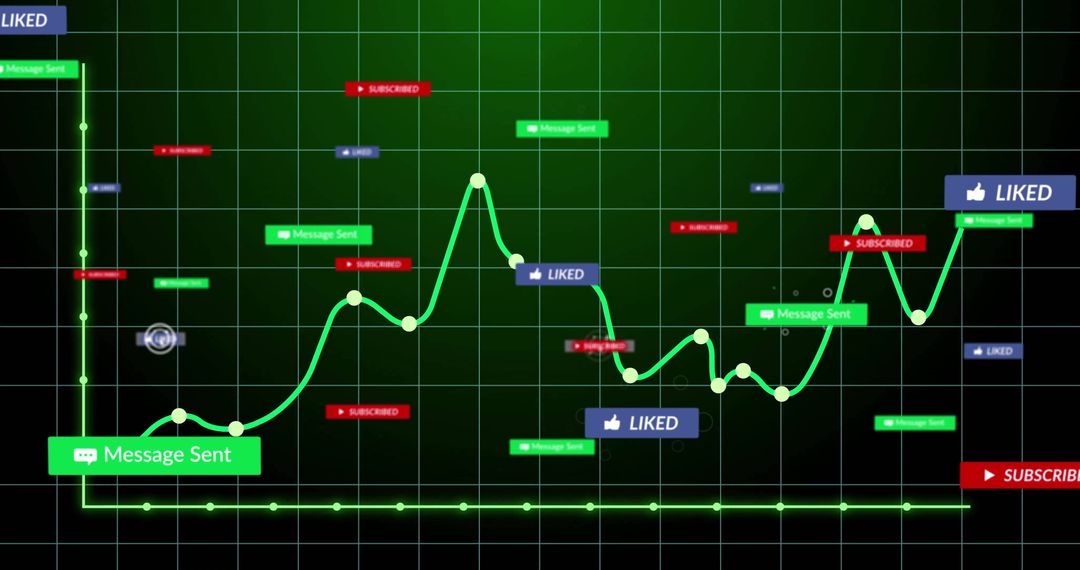
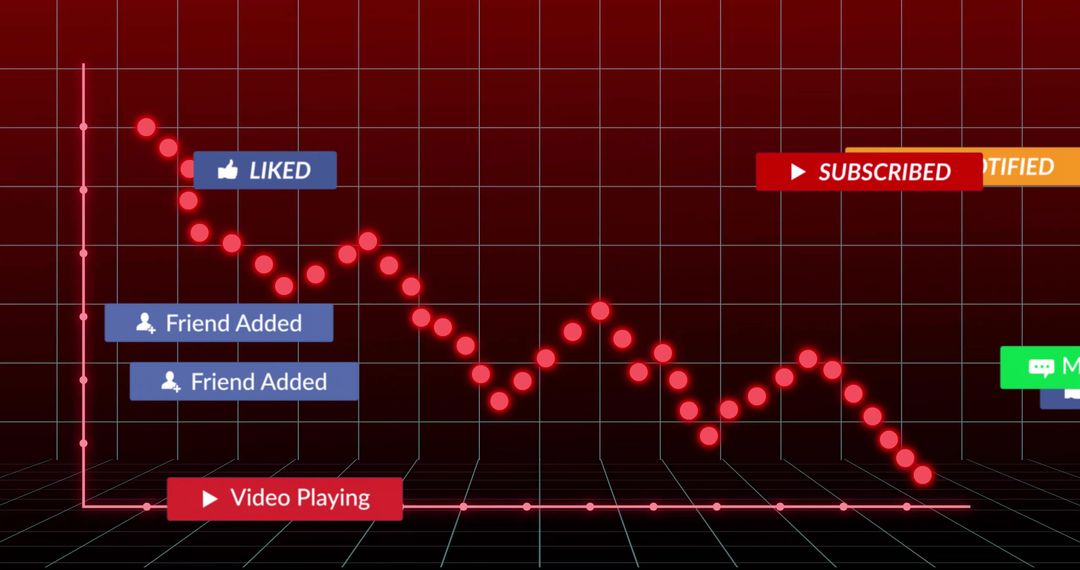
- Interactive Social Media Metrics Overlaid on Business Data Graph
Interactive Social Media Metrics Overlaid on Business Data Graph Image

Modern infographic depicting social media metrics like likes and comments plotted over fluctuating business graphs, representing digital analytics and user engagement trends. Useful for illustrating articles or presentations on social media marketing strategies, data-driven business analysis, or digital age communication dynamics.
Powered by  - Get 15% off with code: PIKWIZARD15


2
downloads
downloads
Tags:
More
Credit Photo
If you would like to credit the Photo, here are some ways you can do so
Text Link
photo Link
<span class="text-link">
<span>
<a target="_blank" href=https://pikwizard.com/photo/interactive-social-media-metrics-overlaid-on-business-data-graph/2b5b5bf71d5c092f44fce5382fecd85b/>PikWizard</a>
</span>
</span>
<span class="image-link">
<span
style="margin: 0 0 20px 0; display: inline-block; vertical-align: middle; width: 100%;"
>
<a
target="_blank"
href="https://pikwizard.com/photo/interactive-social-media-metrics-overlaid-on-business-data-graph/2b5b5bf71d5c092f44fce5382fecd85b/"
style="text-decoration: none; font-size: 10px; margin: 0;"
>
<img src="https://pikwizard.com/pw/medium/2b5b5bf71d5c092f44fce5382fecd85b.jpg" style="margin: 0; width: 100%;" alt="" />
<p style="font-size: 12px; margin: 0;">PikWizard</p>
</a>
</span>
</span>
Free (free of charge)
Free for personal and commercial use.
Author: Authentic Images
Similar Free Stock Images

Premium


Premium


Premium


Premium


Premium


Premium


Premium


Premium


Premium


Premium


Premium


Premium


Premium


Premium


Premium


Premium


Premium


Premium


Premium


Premium


Premium


Premium


Premium


Premium