- Home >
- Stock Photos >
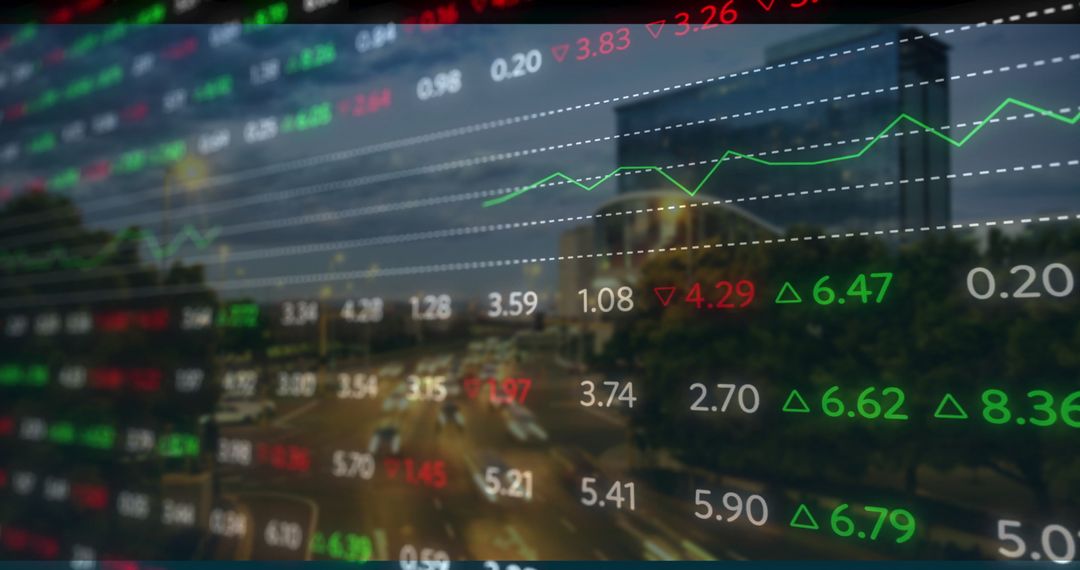
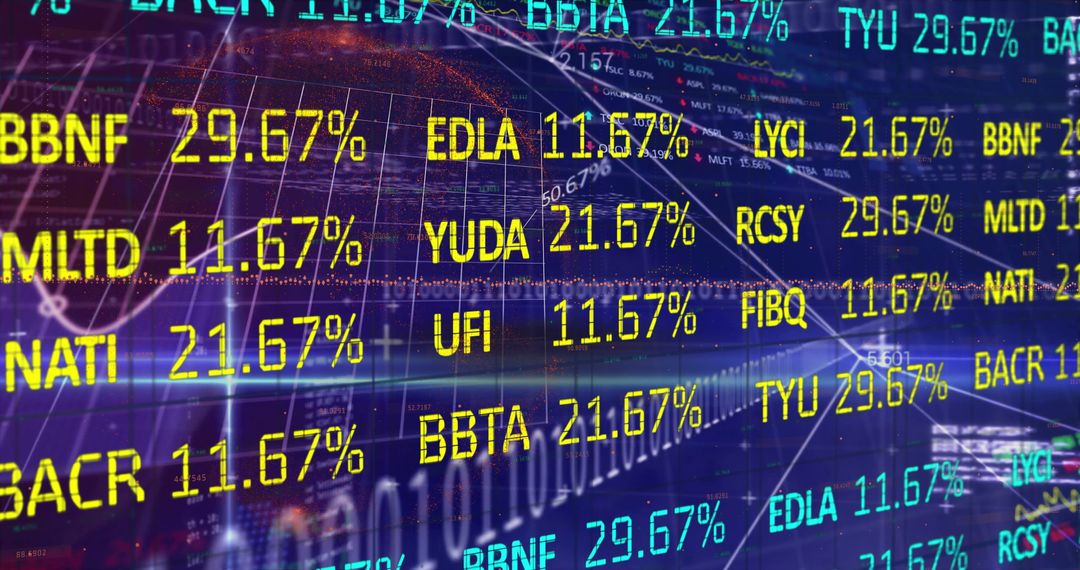
- Interactive Stock Market Dashboard with Data Visualizations
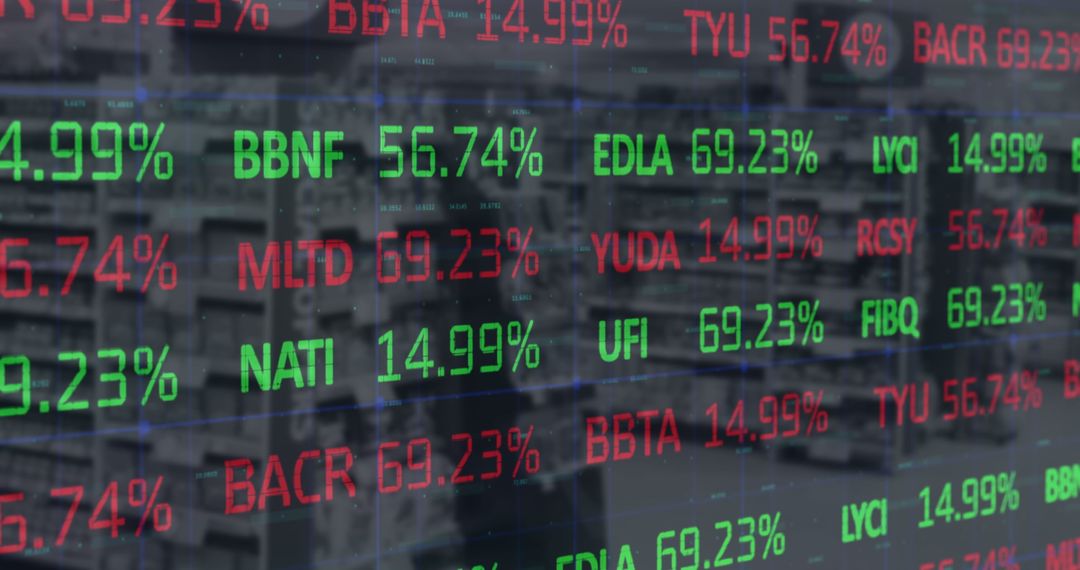
Interactive Stock Market Dashboard with Data Visualizations Image
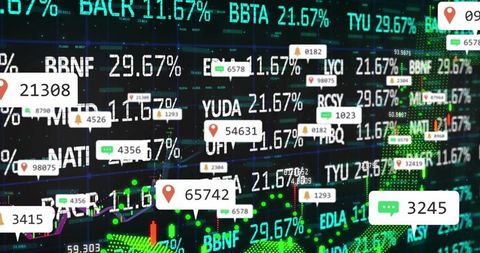
Features a digital trading dashboard with floating data and graphs on an illuminated screen symbolizing the dynamic nature of financial markets. Ideal for illustrating financial analysis, real-time market strategies, investment tools, and technology-driven trading processes on finance articles, websites, and educational platforms.
Powered by 


2
downloads
downloads
Tags:
More
Credit Photo
If you would like to credit the Photo, here are some ways you can do so
Text Link
photo Link
<span class="text-link">
<span>
<a target="_blank" href=https://pikwizard.com/photo/interactive-stock-market-dashboard-with-data-visualizations/0f21b8aa58041f8204b35587c8857458/>PikWizard</a>
</span>
</span>
<span class="image-link">
<span
style="margin: 0 0 20px 0; display: inline-block; vertical-align: middle; width: 100%;"
>
<a
target="_blank"
href="https://pikwizard.com/photo/interactive-stock-market-dashboard-with-data-visualizations/0f21b8aa58041f8204b35587c8857458/"
style="text-decoration: none; font-size: 10px; margin: 0;"
>
<img src="https://pikwizard.com/pw/medium/0f21b8aa58041f8204b35587c8857458.jpg" style="margin: 0; width: 100%;" alt="" />
<p style="font-size: 12px; margin: 0;">PikWizard</p>
</a>
</span>
</span>
Free (free of charge)
Free for personal and commercial use.
Author: Authentic Images
Similar Free Stock Images
Premium


Premium


Premium


Premium


Premium


Premium


Premium


Premium


Premium


Premium


Premium


Premium


Premium


Premium


Premium


Premium


Premium


Premium


Premium


Premium


Premium
![[The European Union flag in focus against blurred stock market ticker background at night]](https://t3.ftcdn.net/jpg/16/64/41/60/360_F_1664416066_qGmY6r0XMD1YPstBZvZDpVE3Ep8avAME.jpg)


Premium


Premium


Premium