1. Home > 
  2. Stock Photos > 
  3. Interactive Touchscreen with Neon Graphics and Data Visualization

Interactive Touchscreen with Neon Graphics and Data Visualization Image

Interactive Touchscreen with Neon Graphics and Data Visualization

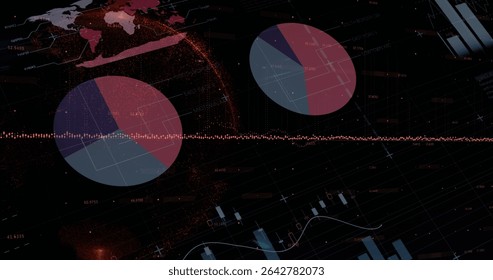
The image depicts an advanced touchscreen interface highlighted by neon graphics and vibrant data visuals, including a curved line chart. The interactive design encourages user engagement with 'TAP HERE' prominently displayed, making it ideal for presentations, blogs, or marketing materials focused on cutting-edge technology, data analytics, digital transformations, and futuristic business solutions. Its visually engaging elements can also enhance website headers or social media posts related to tech innovations.

Powered by Shutterstock logo - Get 15% off with code: PIKWIZARD15
Hands interacting with futuristic AI interface, glowing blue tech graphics and data charts on dark background, concept of smart digital innovation - Powered by Shutterstock - Get 15% off with code: PIKWIZARD15Displaying neon-blue waveform on dashboard with data charts, gauge dials, gear icon and timestamps. Futuristic, digital, visualization, high-tech, interface, analytics, dashboard - Powered by Shutterstock - Get 15% off with code: PIKWIZARD15Virtual screen business intelligence dashboard, analytics and big data technology concept. - Powered by Shutterstock - Get 15% off with code: PIKWIZARD15Double exposure of business theme hologram on empty room interior background. Business concept - Powered by Shutterstock - Get 15% off with code: PIKWIZARD15Creating innovative technologies. Mixed media - Powered by Shutterstock - Get 15% off with code: PIKWIZARD15

Credit Photo

If you would like to credit the Photo, here are some ways you can do so

Free (free of charge)

Free for personal and commercial use.

Author: Creative Art

Similar Free Stock Images

Digital Data Processing Interface with Futuristic Visuals
Premium
Developer collaborated with finance, commerce departments to find bugs, economic software system, streamlined transaction processes, supported sales, analyzed on shared screen for effective decision
Diverse Graphs and Data Over Urban Landscape
Selective Data Points on Dark Analytics Dashboard with Sleek Design
Data Analytics with Stock Market Chart Display
Dynamic Financial Data Charts and Digital Interface Concepts
Premium
Double exposure of desktop computer and technology theme hologram. Concept of software development.
Financial Graphs and World Map Illustrating Market Data
Futuristic Financial Data Analytics with Digital Interface Concept
Stock Market Analysis with Graphs and Trading Data
Digital Stock Market Data and Financial Charts Interface
Futuristic Data Visualization Dashboard with Neon Green Line Chart
Abstract Data Chart with Graphical Patterns
Digital Financial Data Display with Graphs and Analytics
Digital Financial Statistics and Analytics Visualization with Graphs
Digital Interface Displaying Stock Market Data and Statistics
Premium
A close-up view of a business analytics dashboard featuring touchscreen interaction. The image showcases financial metrics, data visualization, and performance tracking elements for professionals.
Dynamic Financial Data Analytics with Stock Market Trends
Cybersecurity Dashboard With Data and Code Elements Display
Stock Market Dashboard with Analytics and Graphs
Digital Stock Market Data Interface with Charts and Graphs
Premium
Sustainable business practices, green innovation, eco-friendly solutions, climate action, and long-term sustainability strategies supporting environmental goals and corporate responsibility. Thunk
Premium
Business intelligence dashboard with graph and icons. Big data. Trading and investment. Modern technology concept on virtual screen.
Dynamic Digital Display of Financial Data
Digital Financial Data Processing Interface on Red Background
Futuristic Financial Data Analysis with Graphs and Charts
Premium
Displaying waveform streaming data on tech dashboard, with floating panels, gauges and charts. Futuristic, holographic, data visualization, digital interface, technology, innovation, analytics
Armed Forces Day with Digital Graphs Overlaid
Digitized Financial Data Analysis with Graphs and Codes
Digital Financial Data Analytics with Graphs and Codes
Financial Visualization Overlooking Urban Cityscape
Premium
Conceptual business dashboard for financial data analysis . 3D render computer graphic .
Global Data Analytics and Network Visualization on Digital Grid
Digital Display of Financial Data with Graph and Figures
Premium
Business theme drawing with office interior background. Double exposure. Concept of success.
Futuristic Finance Dashboard with Glowing Smile Symbol
Premium
Displaying large pie chart at lower left on dashboard, with glowing globe and waveform, copy space. Data visualization, analytics, technology, digital interface, futuristic, business intelligence,
Futuristic Analytics Dashboard Displaying Line Chart, Sparklines, Notification Badges and Realtime M
Digital Financial Data Analytics on Dark Interface
Digital Data Processing with Technology Interface on Blue Background
Global Financial Data Processing with Graphs and Charts on Dark Background
Dynamic Financial Graphs Illustrating Business Growth
Dynamic Financial Graph Displaying Market Trends
Analyzing Financial Data with Global Trends and Charts
Global Data Transfer with Digital Analytics and Visualization
Premium
Person using laptop with financial charts, colorful data infographics on transparent digital interface, futuristic analytics and business concept
Financial Data Processing with Charts and Graphics on Digital Blue Background
Global Economy and Stock Market Data Concept Visualization
Graphical Display of Stock Market Trends with Gradient Background
Digital Financial Data Interface on Green Background
Premium
Human's hands with data theme multi exposure background drawings. Concept of innovation.
Advanced Digital Data Analytics and Visualization Dashboard
Financial Data Processing with Graphs and Charts Background
Economic Impact of Rising Sea Levels and Climate Change
Financial Data Charts with Network Connections Digital Interface
Premium
Interface financial application . Mixed media
Dark Financial Dashboard Displaying Real-Time Analytics, Index Table, Americas Map, Gauges
Abstract Financial Data Processing on Digital Grid Background
Interactive Financial Dashboard with Graphs and Data Labels
Dynamic Financial Data Graph Illustrating Stock Market Trends
Premium
Man in white shirt with technology icons.
Premium
Data dashboard and analytics system supports business, analytics, and data insights through centralized charts, statistics, and monitoring interface Latch
Holographic Stock Market Analysis with Charts and Data
Dynamic Digital Data Visualization with Graphs and Statistics
Financial Data Stock Analysis with Code Overlays
Futuristic Stock Market Graphs on Digital Display
Dynamic Data Analytics Interface Showing Statistical Trends
Futuristic Financial Data Visualization
Digital Financial Data Analysis on Futuristic Blue Interface
Digital Projection of Financial Data with Bar Graphs
Premium
Business theme hologram on conference room interior background. Double exposure. Concept of brainstorming in business.
Premium
Double exposure of business theme drawings on digital tablet on the table background. Concept of online business
Premium
Double exposure of desktop with computer on background and tech theme drawing. Concept of big data.
Digital Finance Interface with Data Visualization on Blue Background
Digital Financial Data Analysis with Graphs and Charts
Digital Financial Dashboard with Cyan Bar and Red Line Graph
Digital Data Dashboard with Transparent Financial Graphs
Premium
Template for text, Virtual screen Background. Business, internet technology and networking concept.
Digital Data Analysis and Global Financial Market Indicators
Global Financial Data Processing with Digital Interface Elements
Digital Financial Data Analysis on Abstract Blue Background
Dynamic Data Visualization on Digital Dashboard Display
Premium
Image of round scanners and data processing against time-lapse of city traffic at night. Computer interface and business technology concept
Digital Data Processing Displaying Financial Charts and Code
Finance and Technology Concept with Holographic Graphs
Neon Circle Highlights Bullish Trend on Digital Dashboard
Global Data Processing Technology on Digital Grid
Premium
Hand working with Technical Support and Customer Service Business Technology Internet Ui.
Graph and Chart Display on White Grid Background
Stock Market Analysis and Data Processing Graphic
Stock Market Trends and Data Analysis over Digital Grid
Dynamic Digital Stock Market Chart with Growing Financial Trends
Stock Market Analysis Digital Screen with Graphs and Trends
Digital Financial Data Stream with Numeric Overlay
Digital Financial Data Processing and Analysis Graphics
Cybersecurity Visualization with HTML Code and Analytics Chart
Global Financial Data Analytics and Economic Graphs
Premium
Business Intelligence and Data Analytics Management with Advanced Digital Dashboards.
Dynamic Financial Data Analysis with Virtual Screen
Financial Graph Showing Indices Trends on Blue Background
Data Processing Overlaid on Graphs and Code in Digital Interface
Abstract Graphic Business Data Visualization
Financial Data Analysis with Digital Graph Overlay on Dark Grid
Futuristic Financial Data Analysis Interface Concept
Digital Data Processing Dashboard in Global Connection Visualization
Premium
Businessman interacting with futuristic digital dashboard showing data analytics charts graphs and global statistics representing big data business intelligence financial analysis and smart technology
Premium
Image of data processing over scope scanning and cables of computer server. global connections, data processing and computing concept digitally generated image.
Futuristic Digital Finance Dashboard with Charts and Tickers
Digital Financial Data Interface with Graphs and Trends
Digital Security in Stock Market Analysis and Trading
Financial Data Analytics on Digital Interface
Premium
Displaying multicolored candlestick and dotted trend charts on trading dashboard, with world map. Finance, analytics, technology, dashboard, data, investment, digital
Digital Fintech Visualization with Graphs and Data Icons
Financial Data Analytics with Graphs and statistics
Financial Data Processing Visualization on Dark Background
Financial Analytics Dashboard with Growth Trends and Indicators
Financial Data Processing on Digital Graph Displayed on Screen
Digital Data Interface with Global Financial Statistics
Dynamic Global Financial Data with Multicolored Graph Lines
Abstract Digital Data Charts Illustrating Market Trends
Digital Data Processing and Stock Market Visualization
Premium
A business professional using a futuristic touchscreen interface to analyze global data and statistics, showcasing the integration of technology and analytics in decision-making.
3D Digital Globe with Financial Data Overlay for Analytics
Digital Data Analysis with Futuristic Charts
Global Data Visualization and Analytics Dashboard Concept
Explore More Free Stock Images