- Home >
- Stock Photos >
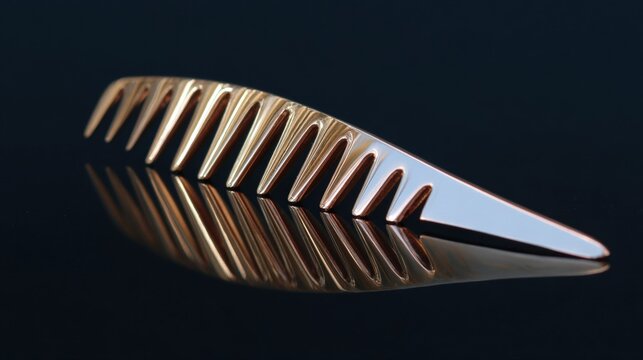
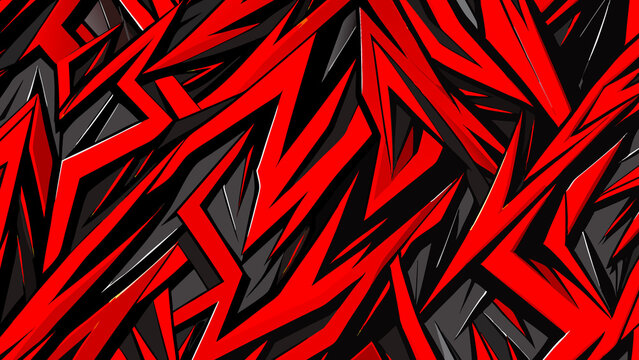
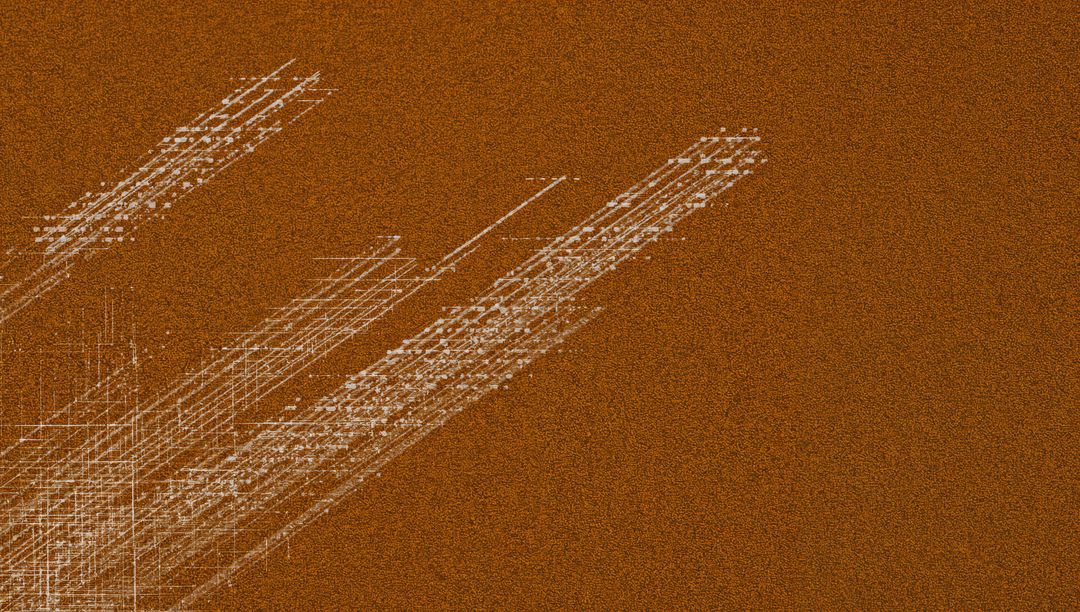
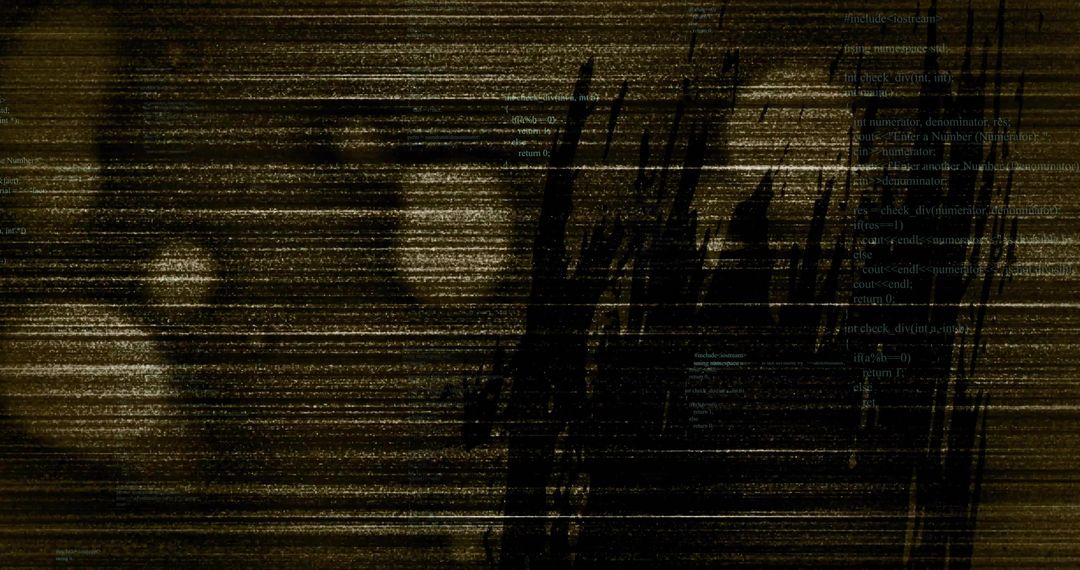
- Jagged Zigzag Ink Slice Cutting Across Streaked Paper Showing Distressed Grain
Jagged Zigzag Ink Slice Cutting Across Streaked Paper Showing Distressed Grain Image
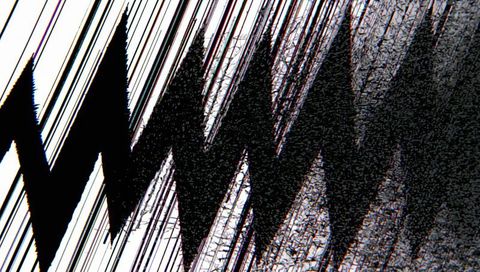
AI Generated Image. High-contrast abstract composition featuring large jagged zigzag black form cutting diagonally across streaked paper, showing heavy ink bleed, speckled grain and digital glitch artifacts. Close-up perspective emphasizing serrated edges, textured ink dispersion and directional streaks. Working well for album covers, poster backgrounds, web banners, editorial spreads, social media headers, packaging and branding projects needing edgy experimental look. Providing bold backdrop for bold typography, logo overlays and layered collage. Suitable for use as texture overlay with multiply or overlay blend modes, for clipping mask details in poster layouts, or for gritty editorial and motion graphics projects where distressed, noisy aesthetic is desired.
Powered by 


0
downloads
downloads
Tags:
More
Credit Photo
If you would like to credit the Photo, here are some ways you can do so
Text Link
photo Link
<span class="text-link">
<span>
<a target="_blank" href=https://pikwizard.com/photo/jagged-zigzag-ink-slice-cutting-across-streaked-paper-showing-distressed-grain/ef8b95f1d820f2defb62485bbf72f795/>PikWizard</a>
</span>
</span>
<span class="image-link">
<span
style="margin: 0 0 20px 0; display: inline-block; vertical-align: middle; width: 100%;"
>
<a
target="_blank"
href="https://pikwizard.com/photo/jagged-zigzag-ink-slice-cutting-across-streaked-paper-showing-distressed-grain/ef8b95f1d820f2defb62485bbf72f795/"
style="text-decoration: none; font-size: 10px; margin: 0;"
>
<img src="https://pikwizard.com/pw/medium/ef8b95f1d820f2defb62485bbf72f795.jpg" style="margin: 0; width: 100%;" alt="" />
<p style="font-size: 12px; margin: 0;">PikWizard</p>
</a>
</span>
</span>
Free (free of charge)
Free for personal and commercial use.
Author: AI Creator
Similar Free Stock Images

Premium


Premium


Premium


Premium


Premium


Premium


Premium


Premium


Premium


Premium


Premium


Premium


Premium


Premium


Premium


Premium


Premium


Premium


Premium


Premium


Premium


Premium


Premium


Premium