
- Home >
- Stock Photos >
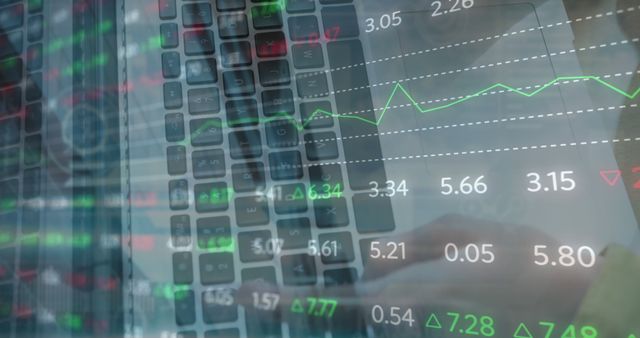
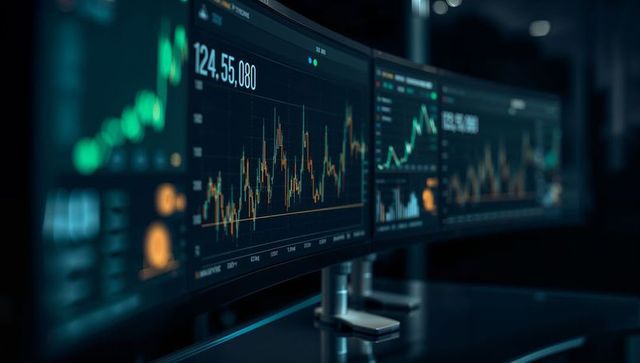
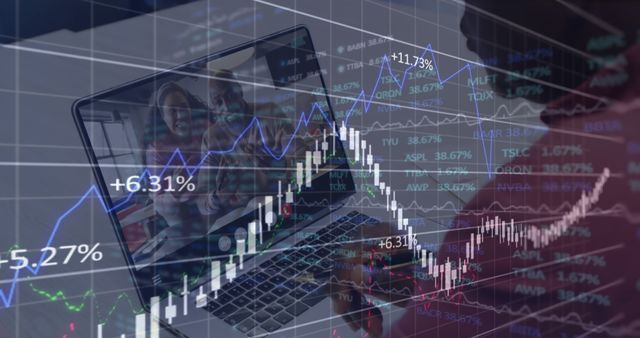
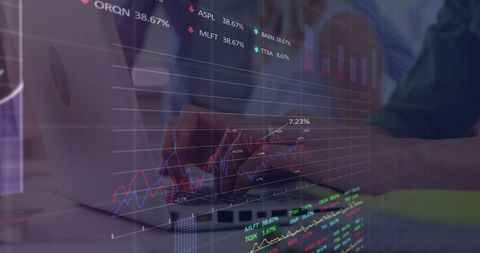
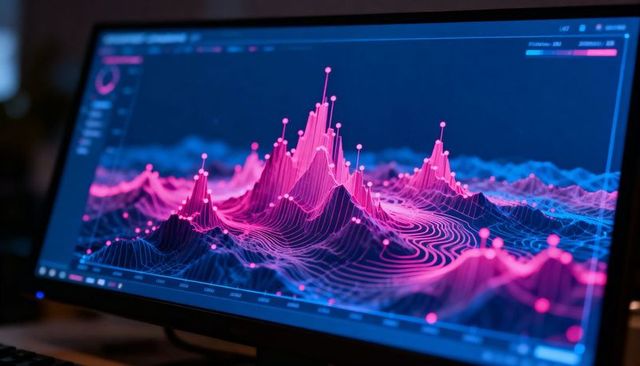
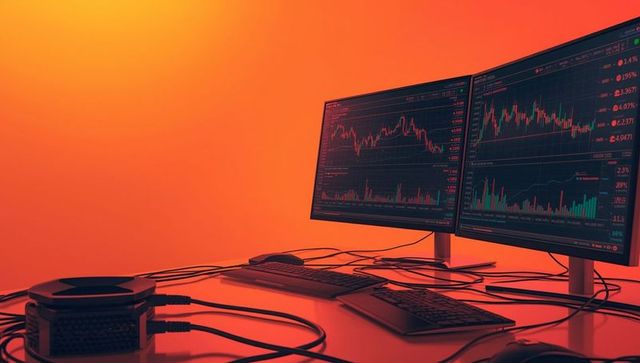
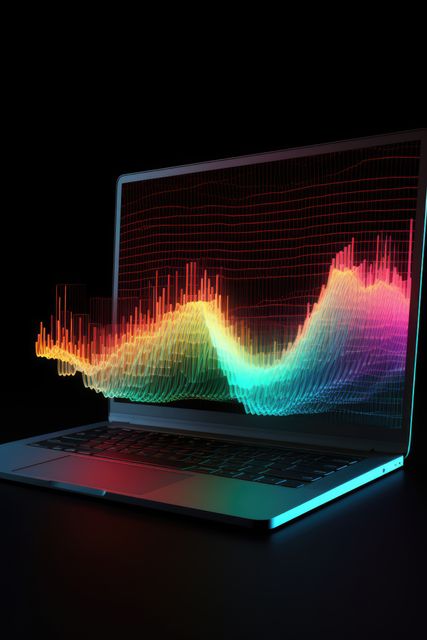
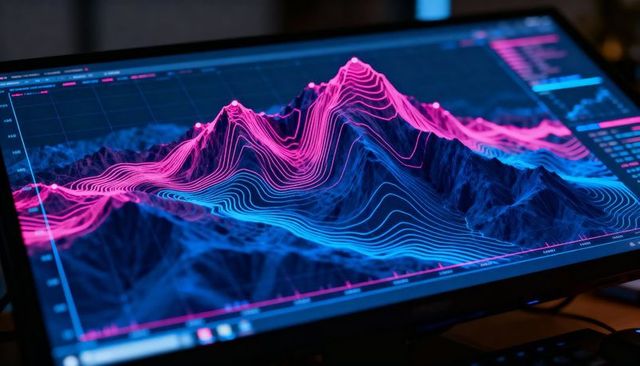
- Laptop Display with Advanced Financial Analytics and Data Visualization
Laptop Display with Advanced Financial Analytics and Data Visualization Image

AI
AI Generated Image. Captivating display of financial charts on a laptop screen embodies modern business and data analysis processes. Ideal for illustrating technology-driven finance, online trading, and economic insights. Perfect for use in business presentations, financial reports, websites on data analytics, and articles about technology in finance industry.

downloads
Tags:
More
Credit Photo
If you would like to credit the Photo, here are some ways you can do so
Text Link
photo Link
<span class="text-link">
<span>
<a target="_blank" href=https://pikwizard.com/photo/laptop-display-with-advanced-financial-analytics-and-data-visualization/d71e1885330381f9a95a5575e6601f8f/>PikWizard</a>
</span>
</span>
<span class="image-link">
<span
style="margin: 0 0 20px 0; display: inline-block; vertical-align: middle; width: 100%;"
>
<a
target="_blank"
href="https://pikwizard.com/photo/laptop-display-with-advanced-financial-analytics-and-data-visualization/d71e1885330381f9a95a5575e6601f8f/"
style="text-decoration: none; font-size: 10px; margin: 0;"
>
<img src="https://pikwizard.com/pw/medium/d71e1885330381f9a95a5575e6601f8f.jpg" style="margin: 0; width: 100%;" alt="" />
<p style="font-size: 12px; margin: 0;">PikWizard</p>
</a>
</span>
</span>
Free (free of charge)
Free for personal and commercial use.
Author: AI Creator
Similar Free Stock Images

AI

AI


AI
AI


AI

AI


AI

AI
AI

AI


AI

AI

AI


AI
AI

AI


AI


AI


AI


AI

AI

AI
AI

AI

AI

AI

AI

AI


AI


AI


AI
AI

AI


AI

AI


AI


AI
AI


AI


AI


AI


AI


AI

AI


AI

AI

Explore More Free Stock Images