
- Home >
- Stock Photos >
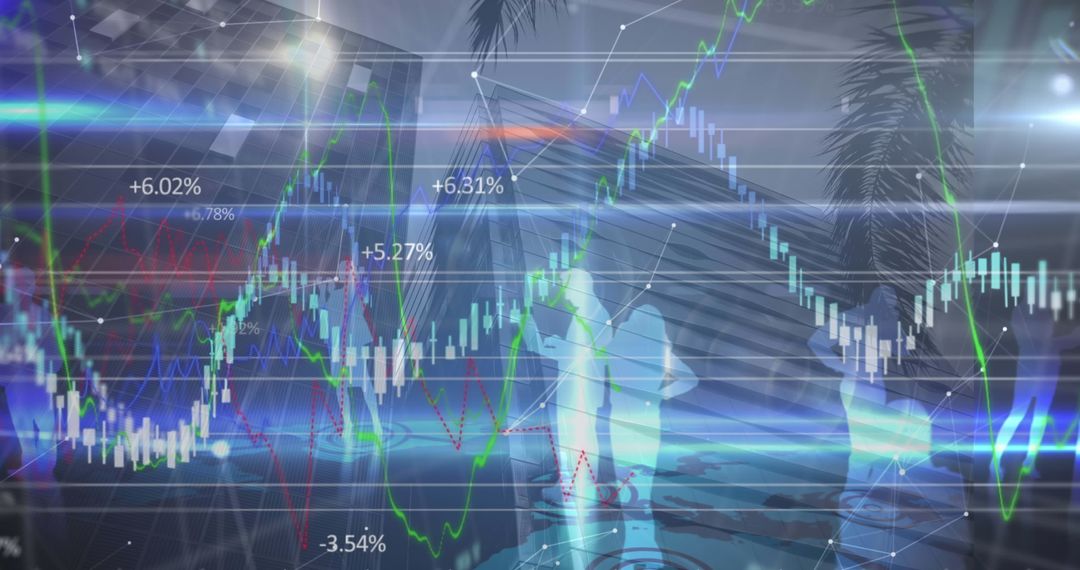
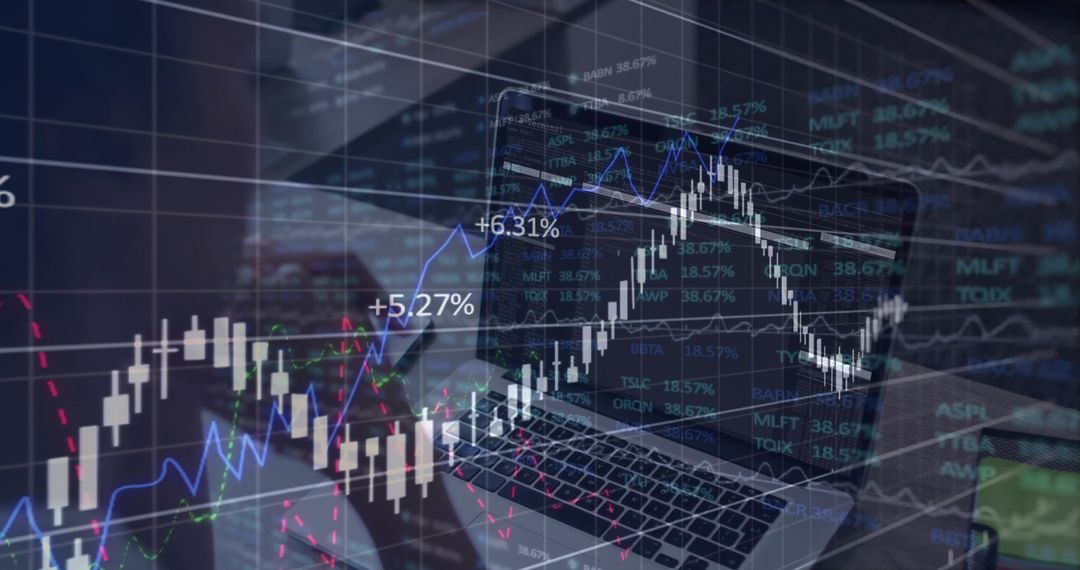
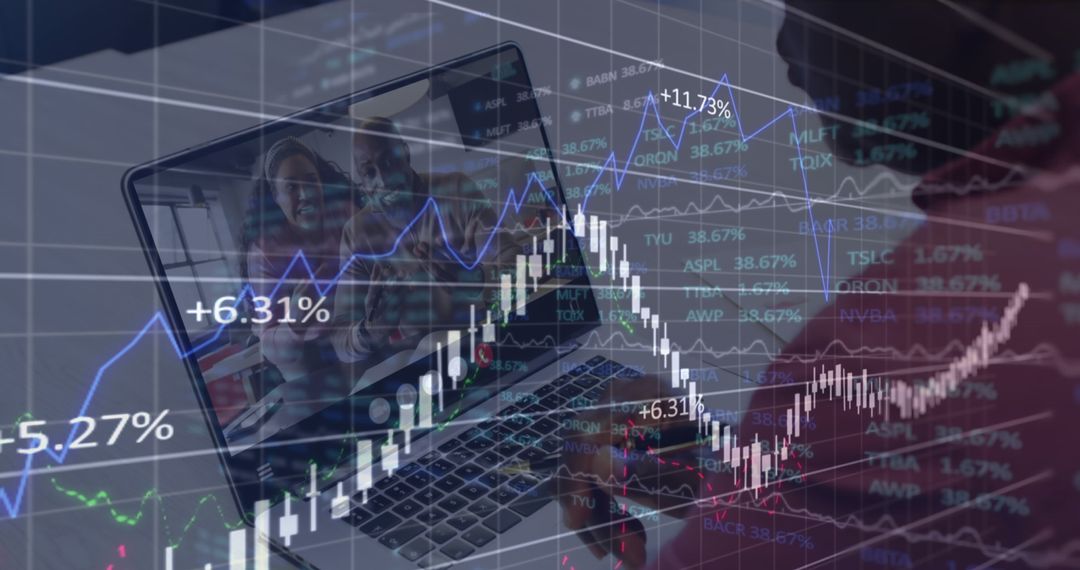
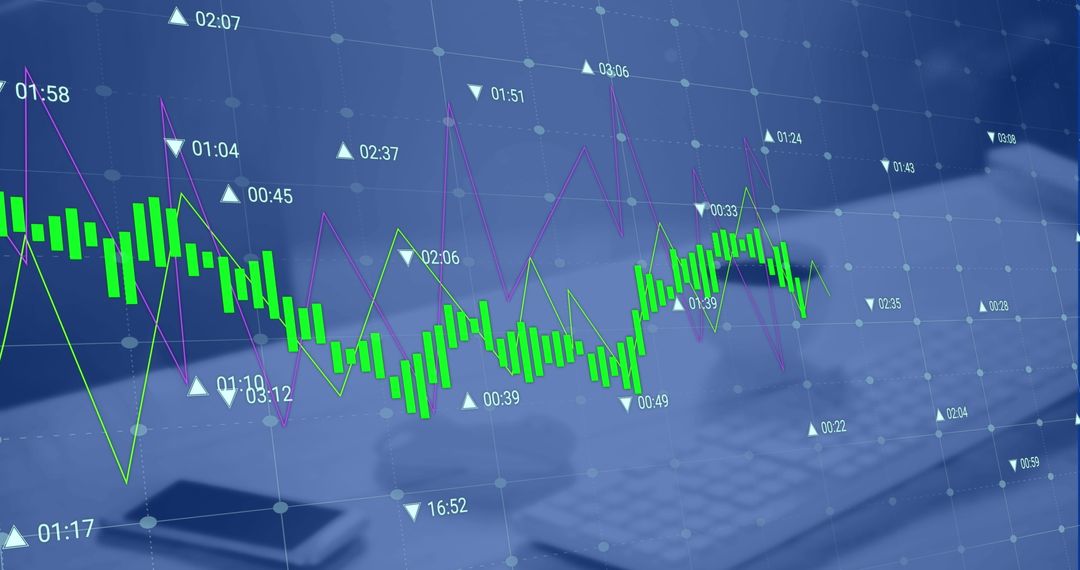
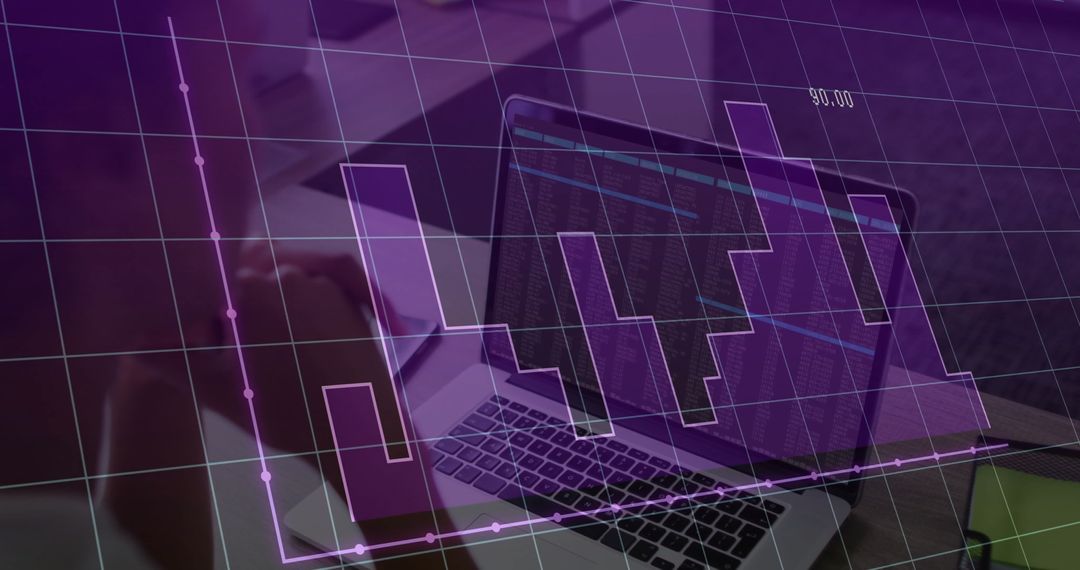
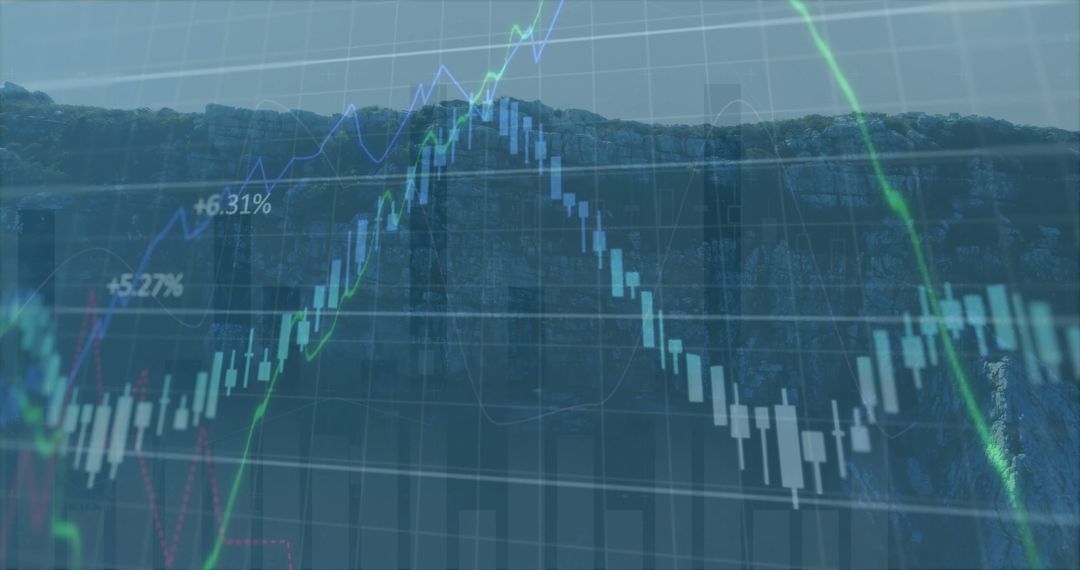
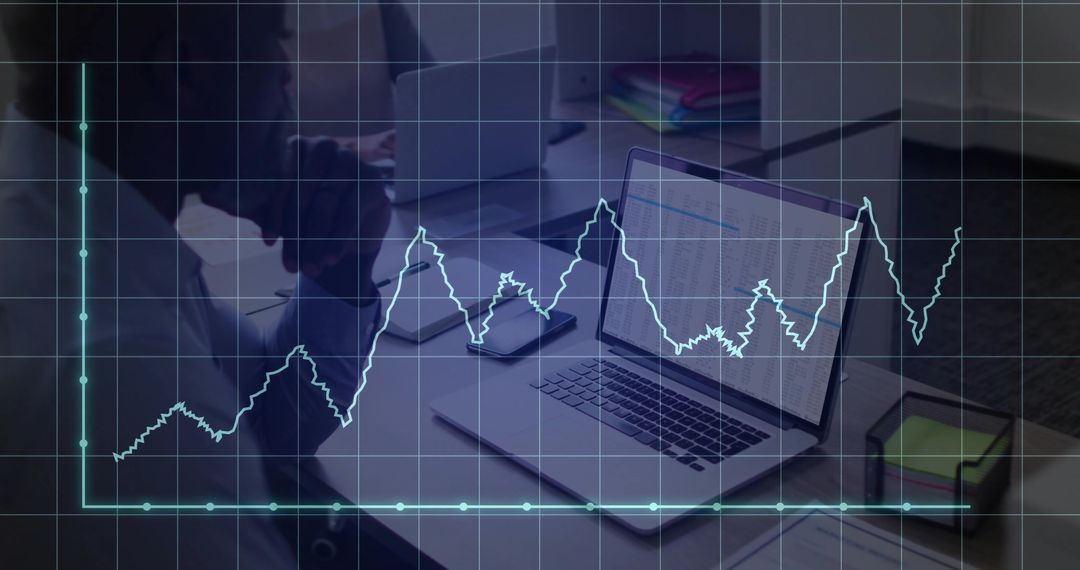
- Laptop Displaying Market Data with Candlestick Chart Overlay
Laptop Displaying Market Data with Candlestick Chart Overlay Image

This image portrays a laptop on a desk showcasing financial data with an overlay of a dynamic candlestick chart, symbolizing the integration of technology and finance. Ideal for content related to financial analysis, trading platforms, economic news articles, investment podcasts, or educational materials focused on stock markets. It effectively communicates the essence of modern finance and digital analysis.
Powered by  - Get 15% off with code: PIKWIZARD15


0
downloads
downloads
Tags:
More
Credit Photo
If you would like to credit the Photo, here are some ways you can do so
Text Link
photo Link
<span class="text-link">
<span>
<a target="_blank" href=https://pikwizard.com/photo/laptop-displaying-market-data-with-candlestick-chart-overlay/7bbf760662c11e0c8570e480e23aad67/>PikWizard</a>
</span>
</span>
<span class="image-link">
<span
style="margin: 0 0 20px 0; display: inline-block; vertical-align: middle; width: 100%;"
>
<a
target="_blank"
href="https://pikwizard.com/photo/laptop-displaying-market-data-with-candlestick-chart-overlay/7bbf760662c11e0c8570e480e23aad67/"
style="text-decoration: none; font-size: 10px; margin: 0;"
>
<img src="https://pikwizard.com/pw/medium/7bbf760662c11e0c8570e480e23aad67.jpg" style="margin: 0; width: 100%;" alt="" />
<p style="font-size: 12px; margin: 0;">PikWizard</p>
</a>
</span>
</span>
Free (free of charge)
Free for personal and commercial use.
Author: Awesome Content
Similar Free Stock Images

Premium


Premium


Premium


Premium


Premium


Premium


Premium


Premium


Premium


Premium


Premium


Premium


Premium


Premium


Premium


Premium


Premium


Premium


Premium


Premium


Premium


Premium


Premium


Premium

