
- Home >
- Stock Photos >
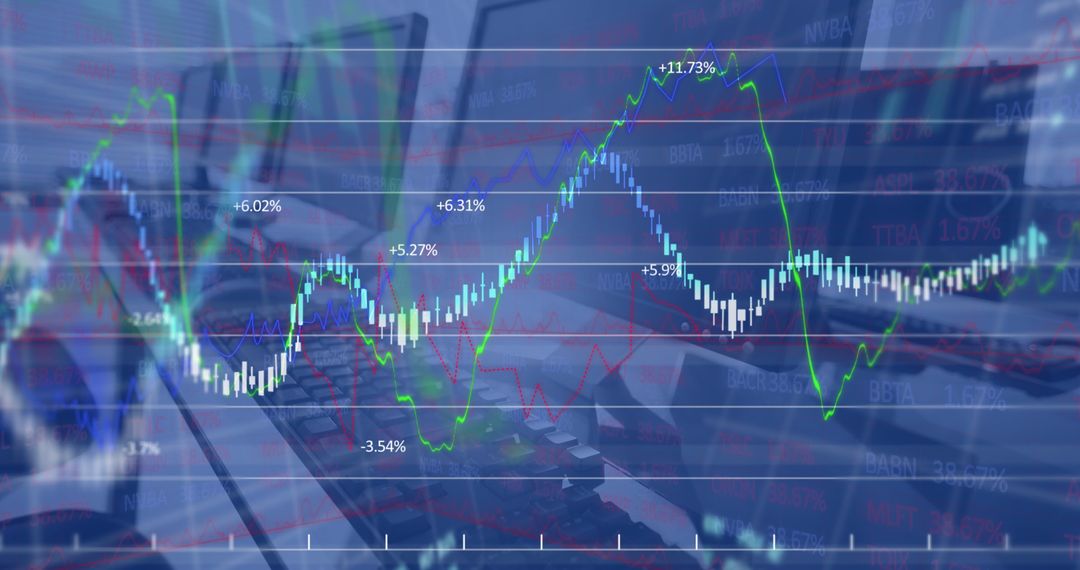
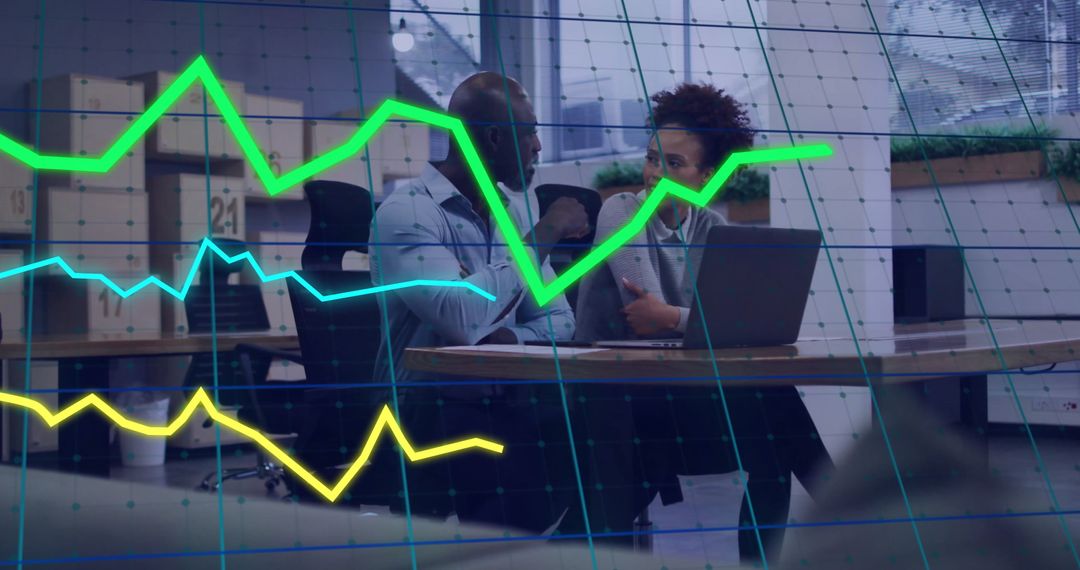
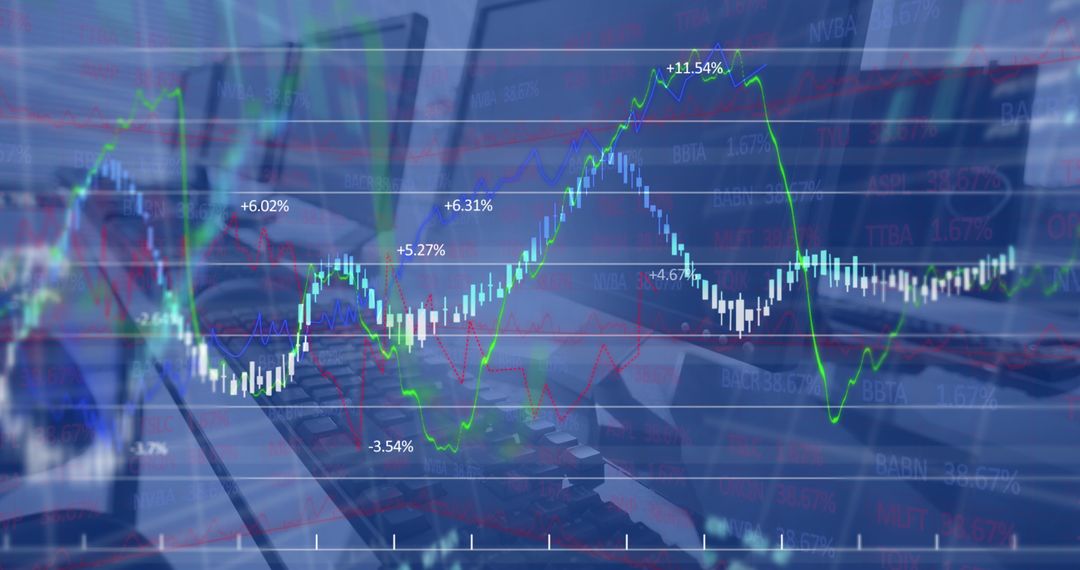
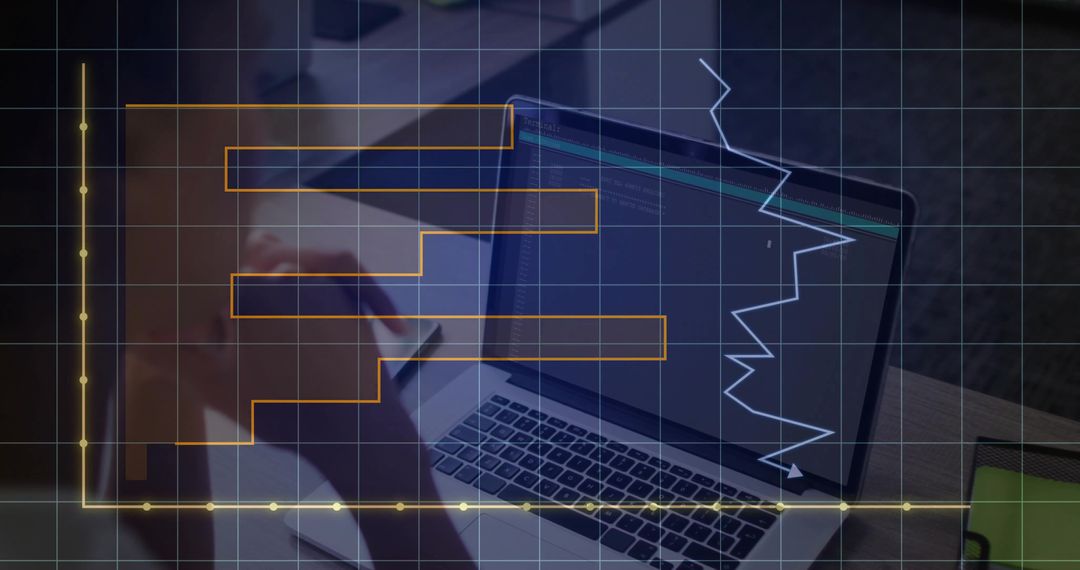
- Laptop Displaying Trading Charts and Data Analysis in Modern Workspace
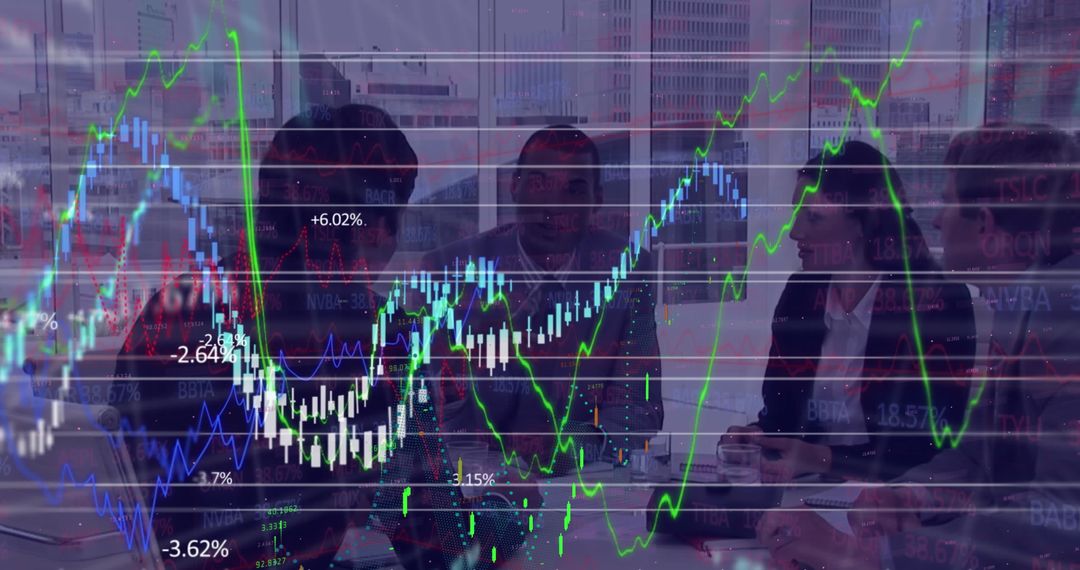
Laptop Displaying Trading Charts and Data Analysis in Modern Workspace Image

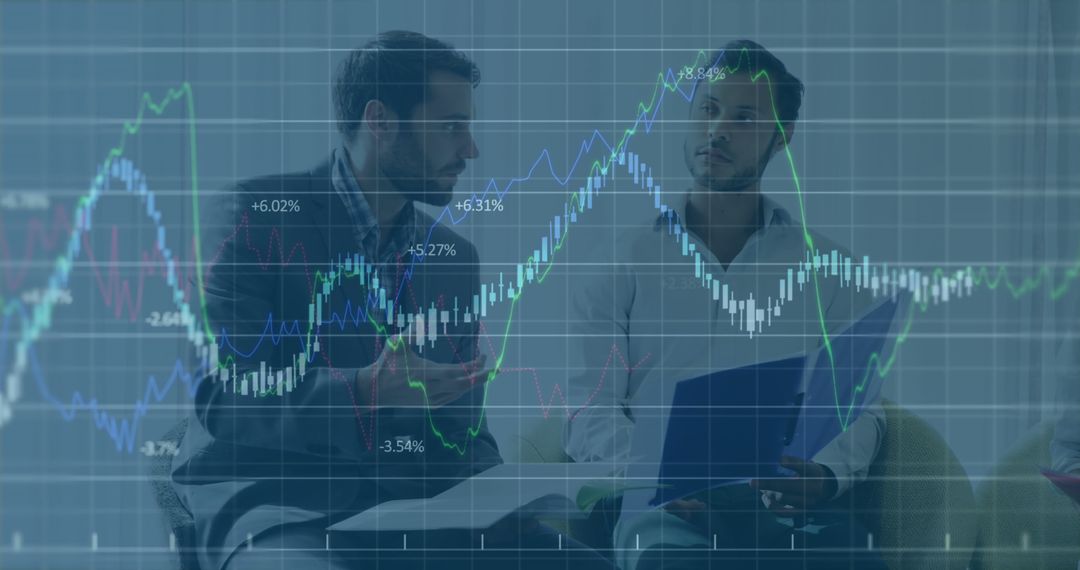
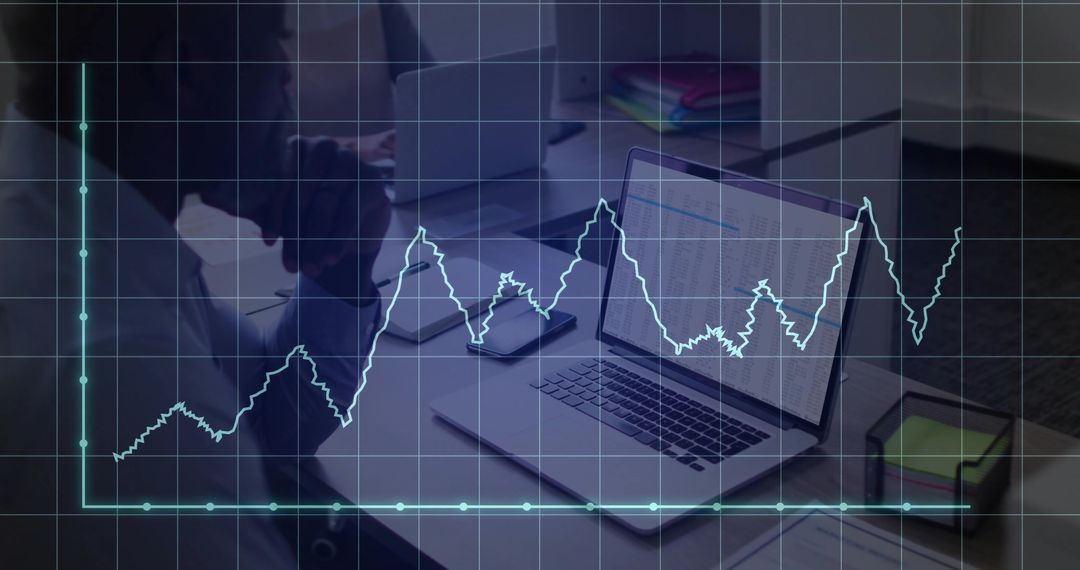
A laptop open on an office desk shows dynamic trading charts with percentages, highlighting data analysis involvement in fintech and modern investments. This visual can be utilized for financial marketing material, technology presentations, investment webinars, and educational content aimed at teaching trading strategies or market analysis skills.
Powered by  - Get 15% off with code: PIKWIZARD15


0
downloads
downloads
Tags:
More
Credit Photo
If you would like to credit the Photo, here are some ways you can do so
Text Link
photo Link
<span class="text-link">
<span>
<a target="_blank" href=https://pikwizard.com/photo/laptop-displaying-trading-charts-and-data-analysis-in-modern-workspace/fc7276324314c827b3cee943131e5128/>PikWizard</a>
</span>
</span>
<span class="image-link">
<span
style="margin: 0 0 20px 0; display: inline-block; vertical-align: middle; width: 100%;"
>
<a
target="_blank"
href="https://pikwizard.com/photo/laptop-displaying-trading-charts-and-data-analysis-in-modern-workspace/fc7276324314c827b3cee943131e5128/"
style="text-decoration: none; font-size: 10px; margin: 0;"
>
<img src="https://pikwizard.com/pw/medium/fc7276324314c827b3cee943131e5128.jpg" style="margin: 0; width: 100%;" alt="" />
<p style="font-size: 12px; margin: 0;">PikWizard</p>
</a>
</span>
</span>
Free (free of charge)
Free for personal and commercial use.
Author: Creative Art
Similar Free Stock Images

Premium


Premium


Premium


Premium


Premium


Premium


Premium


Premium


Premium


Premium


Premium


Premium


Premium


Premium


Premium


Premium


Premium


Premium


Premium


Premium


Premium


Premium


Premium


Premium

