
- Home >
- Stock Photos >
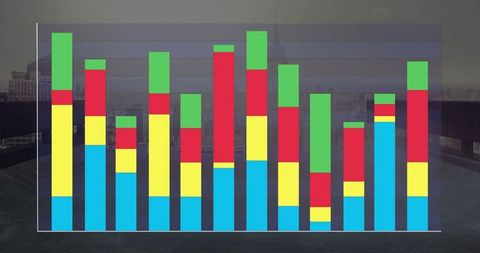
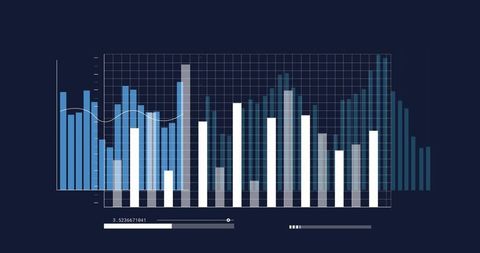
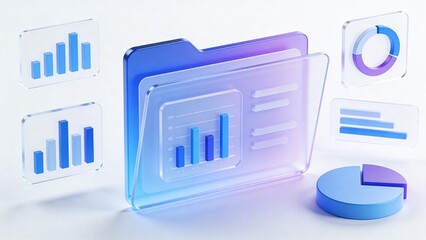
- Layered Bar Chart on Digital Dashboard with Data Analysis Report
Layered Bar Chart on Digital Dashboard with Data Analysis Report Image
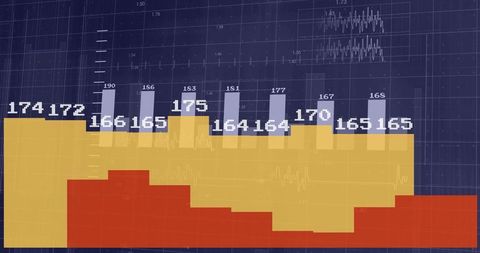
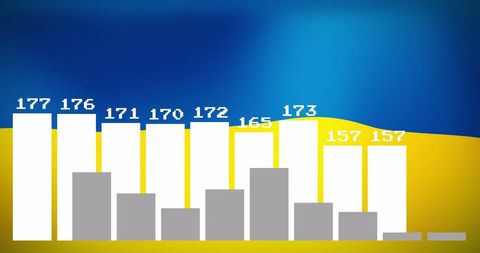
This abstract presentation of layered bar charts on a high-tech dark blue background showcases numeric data labels prominently in a visually engaging manner. Ideal for illustrating business reports, educational materials on data analytics, or visual assets in technology-related websites. The arrangement and vivid colors make it attention-grabbing and informative.
Powered by 


downloads
Tags:
More
Credit Photo
If you would like to credit the Photo, here are some ways you can do so
Text Link
photo Link
<span class="text-link">
<span>
<a target="_blank" href=https://pikwizard.com/photo/layered-bar-chart-on-digital-dashboard-with-data-analysis-report/895539cb4ae1cf50180b4ecb656bcaef/>PikWizard</a>
</span>
</span>
<span class="image-link">
<span
style="margin: 0 0 20px 0; display: inline-block; vertical-align: middle; width: 100%;"
>
<a
target="_blank"
href="https://pikwizard.com/photo/layered-bar-chart-on-digital-dashboard-with-data-analysis-report/895539cb4ae1cf50180b4ecb656bcaef/"
style="text-decoration: none; font-size: 10px; margin: 0;"
>
<img src="https://pikwizard.com/pw/medium/895539cb4ae1cf50180b4ecb656bcaef.jpg" style="margin: 0; width: 100%;" alt="" />
<p style="font-size: 12px; margin: 0;">PikWizard</p>
</a>
</span>
</span>
Free (free of charge)
Free for personal and commercial use.
Author: People Creations
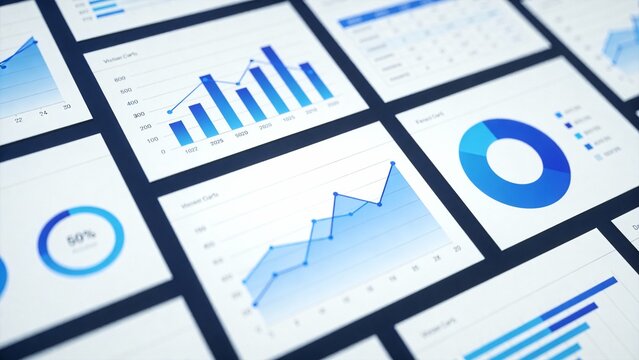
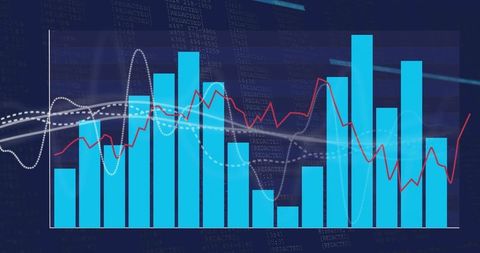
Similar Free Stock Images
Premium


Premium


Premium


Premium


Premium


Premium


Premium


Premium

Premium

Premium


Premium


Premium


Premium


Premium


Premium


Premium


Premium

Premium


Premium


Premium

Premium


Premium


Premium


Premium


Premium


Explore More Free Stock Images