
- Home >
- Free Stock Photos & Images >
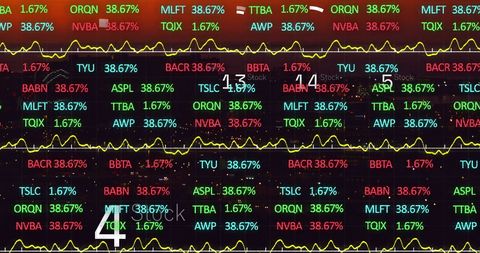
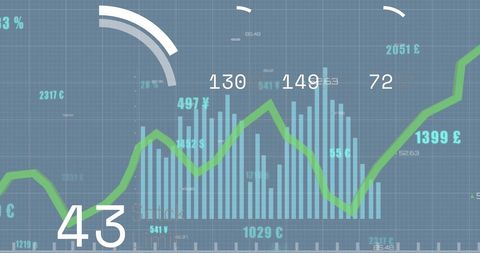
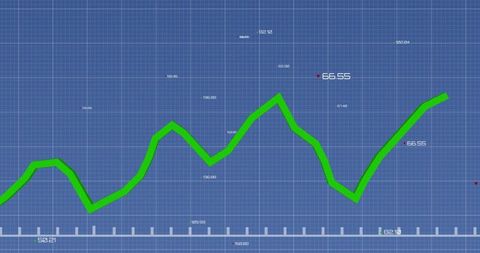
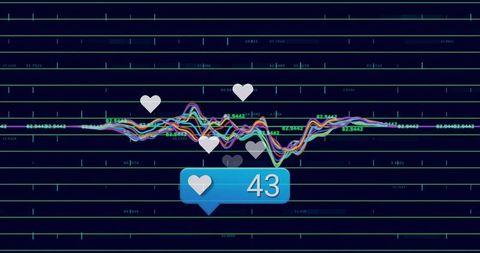
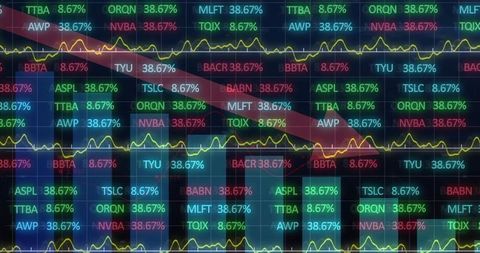
- Layered Data Visualization Dashboard with Notification Widgets and Numeric Tickers
Layered Data Visualization Dashboard with Notification Widgets and Numeric Tickers Free Stock Image

Layered data visualization displaying translucent area charts, numeric ticks, line graphs, and notification badges with location pins and heart icons over gradient teal-purple background. Color palette featuring teal, purple, yellow, and muted gray creating modern fintech aesthetic. Composition offering strong headline space at top-left and clean area for caption or logo at bottom-right. Use for presentations, investor reports, website hero banners, app interface mockups, social media posts, and marketing materials to illustrate analytics, engagement metrics, stock performance, or UX concepts. Consider overlaying semi-transparent text, adding KPI callouts, or animating chart elements for video or interactive use.
Powered by  - Get 15% off with code: PIKWIZARD15


downloads
Tags:
More
Credit Photo
If you would like to credit the Photo, here are some ways you can do so
Text Link
photo Link
<span class="text-link">
<span>
<a target="_blank" href=https://pikwizard.com/photo/layered-data-visualization-dashboard-with-notification-widgets-and-numeric-tickers/f27fe61c2ecbc8a6937ab72e73e89a14/>PikWizard</a>
</span>
</span>
<span class="image-link">
<span
style="margin: 0 0 20px 0; display: inline-block; vertical-align: middle; width: 100%;"
>
<a
target="_blank"
href="https://pikwizard.com/photo/layered-data-visualization-dashboard-with-notification-widgets-and-numeric-tickers/f27fe61c2ecbc8a6937ab72e73e89a14/"
style="text-decoration: none; font-size: 10px; margin: 0;"
>
<img src="https://thumbs.wbm.im/pw/medium/f27fe61c2ecbc8a6937ab72e73e89a14.jpg" style="margin: 0; width: 100%;" alt="Layered Data Visualization Dashboard with Notification Widgets and Numeric Tickers" />
<p style="font-size: 12px; margin: 0;">PikWizard</p>
</a>
</span>
</span>
Free (free of charge)
Free for personal and commercial use.
Author: Awesome Content
Similar Free Stock Images


Premium


Premium


Premium


Premium


Premium


Premium


Premium


Premium


Premium


Premium


Premium


Premium


Premium


Premium


Premium


Premium


Premium


Premium


Premium


Premium


Premium


Premium


Premium


Premium


Premium

Explore More Free Stock Images