- Home >
- Stock Photos >
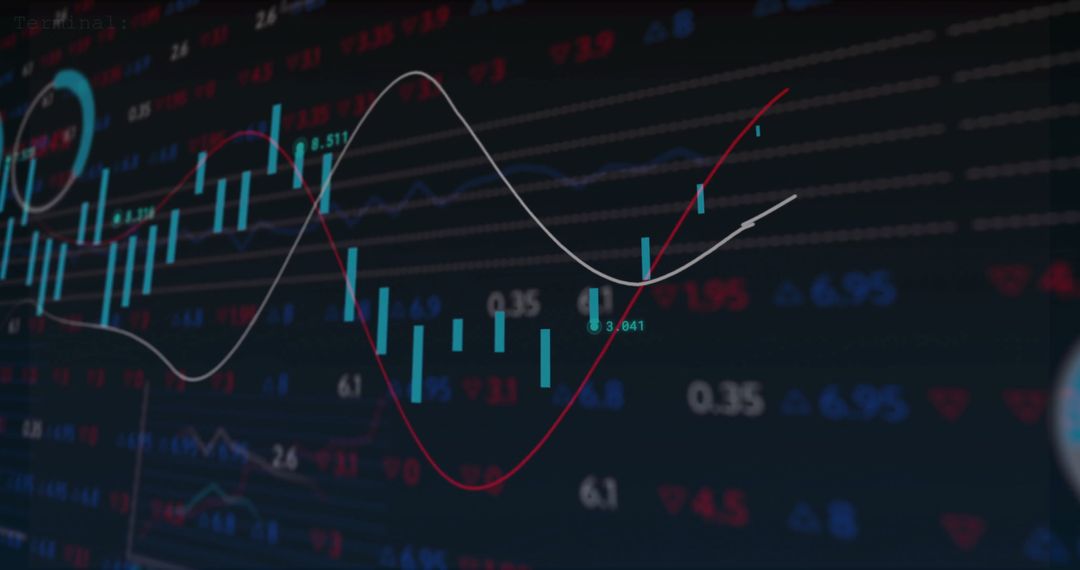
- Layered Digital Finance Dashboard with Candlesticks, Line Graphs and Binary Grid Overlay
Layered Digital Finance Dashboard with Candlesticks, Line Graphs and Binary Grid Overlay Image

Showing layered candlestick and line charts over binary grid with translucent pie overlay and numeric tick data, creating dynamic fintech visual. Featuring neon blue and red highlights, subtle depth and motion blur for high-tech atmosphere. Ideal for fintech websites, trading platform dashboards, investor reports, cryptocurrency marketing, data analytics presentations. Enhancing hero headers, background art, slide decks, social media ads, blog banners, and printed marketing materials. Supplying clean space for headline text and UI overlay elements. Delivering modern abstract visual for conveying market volatility, algorithmic trading, big data, and financial technology concepts.
Powered by 


0
downloads
downloads
Tags:
More
Credit Photo
If you would like to credit the Photo, here are some ways you can do so
Text Link
photo Link
<span class="text-link">
<span>
<a target="_blank" href=https://pikwizard.com/photo/layered-digital-finance-dashboard-with-candlesticks-line-graphs-and-binary-grid-overlay/8a313eb45f2b1a96dbd7fb3e949083b7/>PikWizard</a>
</span>
</span>
<span class="image-link">
<span
style="margin: 0 0 20px 0; display: inline-block; vertical-align: middle; width: 100%;"
>
<a
target="_blank"
href="https://pikwizard.com/photo/layered-digital-finance-dashboard-with-candlesticks-line-graphs-and-binary-grid-overlay/8a313eb45f2b1a96dbd7fb3e949083b7/"
style="text-decoration: none; font-size: 10px; margin: 0;"
>
<img src="https://pikwizard.com/pw/medium/8a313eb45f2b1a96dbd7fb3e949083b7.jpg" style="margin: 0; width: 100%;" alt="" />
<p style="font-size: 12px; margin: 0;">PikWizard</p>
</a>
</span>
</span>
Free (free of charge)
Free for personal and commercial use.
Author: People Creations
Similar Free Stock Images

Premium


Premium


Premium


Premium


Premium


Premium


Premium


Premium


Premium


Premium


Premium


Premium


Premium


Premium


Premium


Premium


Premium


Premium


Premium


Premium


Premium


Premium


Premium


Premium