- Home >
- Stock Photos >
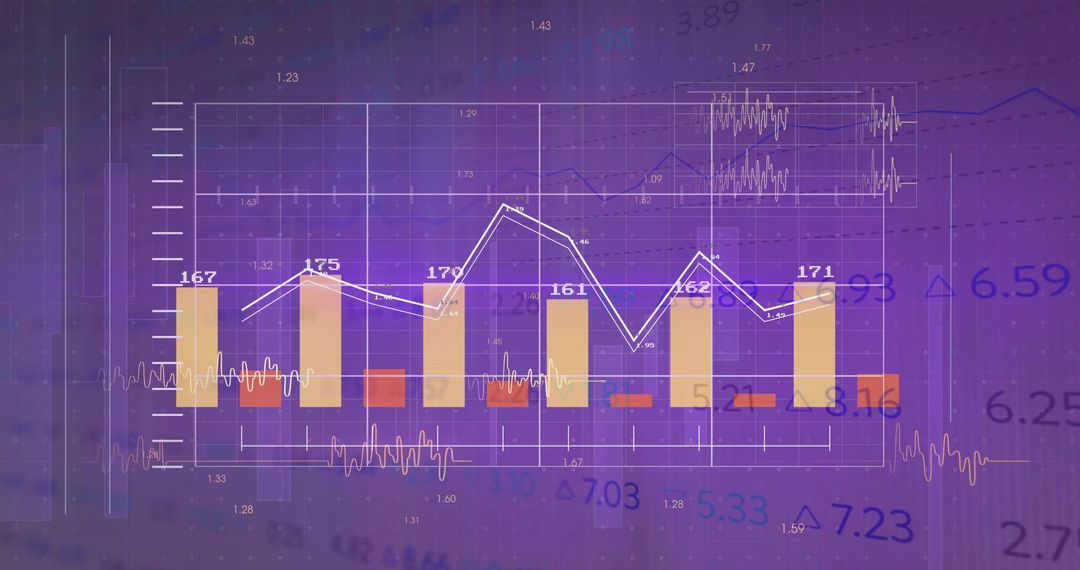
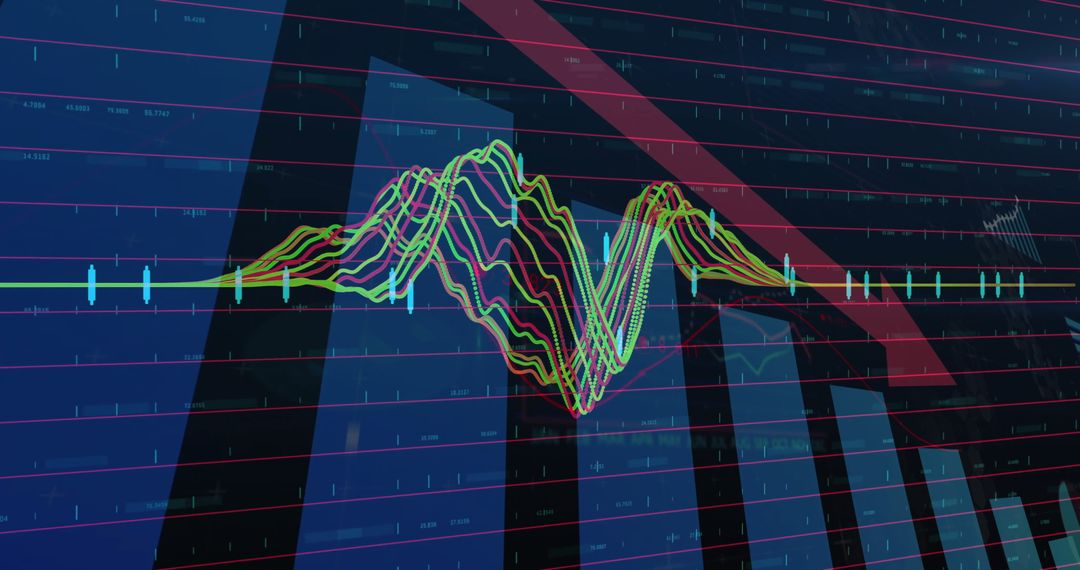
- Layered Interface With Charts and Tickers for Trading Apps
Layered Interface With Charts and Tickers for Trading Apps Image

Multi-layered chart visuals including line and bar graphs with tickers present analytical finance data for professionals in trading environments. Useful for discussions on finance apps, modern technology in finance, or stock market analysis tools and apps.
Powered by 


0
downloads
downloads
Tags:
More
Credit Photo
If you would like to credit the Photo, here are some ways you can do so
Text Link
photo Link
<span class="text-link">
<span>
<a target="_blank" href=https://pikwizard.com/photo/layered-interface-with-charts-and-tickers-for-trading-apps/31ce869f72bc14403da8eed51eea5a76/>PikWizard</a>
</span>
</span>
<span class="image-link">
<span
style="margin: 0 0 20px 0; display: inline-block; vertical-align: middle; width: 100%;"
>
<a
target="_blank"
href="https://pikwizard.com/photo/layered-interface-with-charts-and-tickers-for-trading-apps/31ce869f72bc14403da8eed51eea5a76/"
style="text-decoration: none; font-size: 10px; margin: 0;"
>
<img src="https://pikwizard.com/pw/medium/31ce869f72bc14403da8eed51eea5a76.jpg" style="margin: 0; width: 100%;" alt="" />
<p style="font-size: 12px; margin: 0;">PikWizard</p>
</a>
</span>
</span>
Free (free of charge)
Free for personal and commercial use.
Author: People Creations
Similar Free Stock Images

Premium


Premium


Premium


Premium


Premium


Premium


Premium


Premium


Premium


Premium


Premium


Premium


Premium


Premium


Premium


Premium


Premium


Premium


Premium


Premium


Premium


Premium


Premium


Premium