- Home >
- Stock Photos >
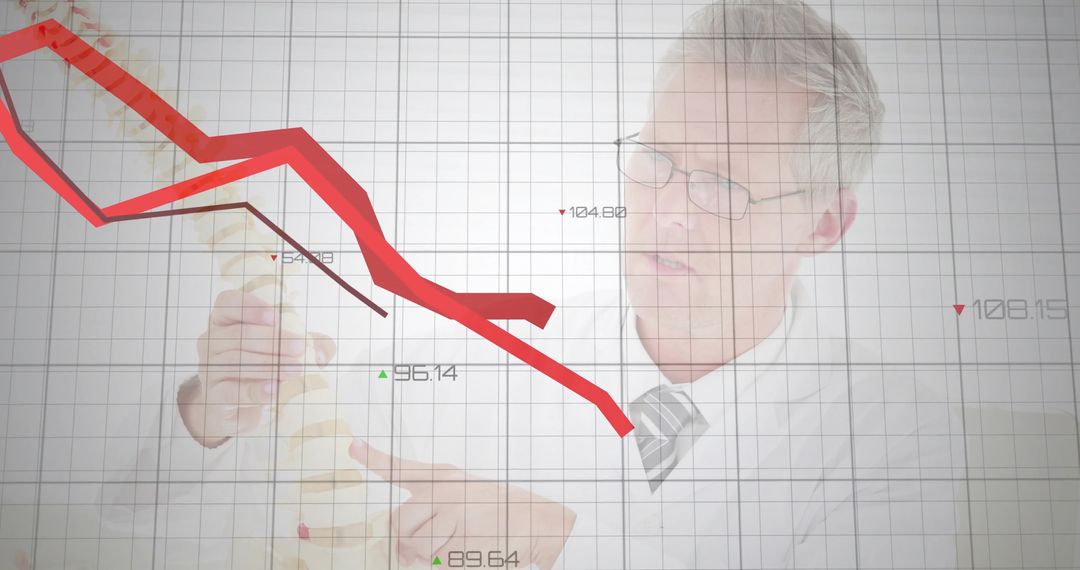
- Line Chart with Tools Symbolizing Precision and Innovation
Line Chart with Tools Symbolizing Precision and Innovation Image

Interconnected lines on chart foreground highlight trends, while placed alongside tools like pliers and scissors to symbolize precision, innovation, and professional analytics. Ideal for business presentations, data analysis visuals, or technology-related publications.
Powered by 


0
downloads
downloads
Tags:
More
Credit Photo
If you would like to credit the Photo, here are some ways you can do so
Text Link
photo Link
<span class="text-link">
<span>
<a target="_blank" href=https://pikwizard.com/photo/line-chart-with-tools-symbolizing-precision-and-innovation/a9613472f8df7005b3ed90d5a9214770/>PikWizard</a>
</span>
</span>
<span class="image-link">
<span
style="margin: 0 0 20px 0; display: inline-block; vertical-align: middle; width: 100%;"
>
<a
target="_blank"
href="https://pikwizard.com/photo/line-chart-with-tools-symbolizing-precision-and-innovation/a9613472f8df7005b3ed90d5a9214770/"
style="text-decoration: none; font-size: 10px; margin: 0;"
>
<img src="https://pikwizard.com/pw/medium/a9613472f8df7005b3ed90d5a9214770.jpg" style="margin: 0; width: 100%;" alt="" />
<p style="font-size: 12px; margin: 0;">PikWizard</p>
</a>
</span>
</span>
Free (free of charge)
Free for personal and commercial use.
Author: Creative Art
Similar Free Stock Images

Premium


Premium


Premium


Premium


Premium


Premium


Premium


Premium


Premium


Premium


Premium


Premium


Premium


Premium


Premium


Premium


Premium


Premium


Premium


Premium


Premium


Premium


Premium


Premium