
- Home >
- Stock Photos >
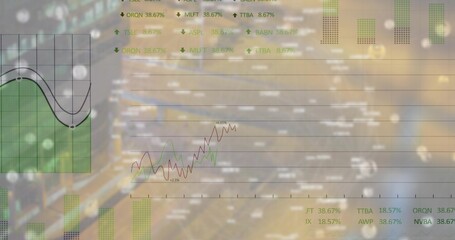
- Line Graph Data Analytics Overlaid on Server Room Digital Grid
Line Graph Data Analytics Overlaid on Server Room Digital Grid Image

Line graphs stream across images of server racks and cables, with a digital grid overlay denoting connectivity and advanced data processing. Influence of technology and digital innovation is prevalent, showcasing analytics integration in cyberspace and digital infrastructure optimization, highlighting concepts of cost tracking, market trend in big data environments. Suitable for illustrating data-driven decision-making, consulting services, and promotions drawing new pitches based around innovation and secure computing solutions.
Powered by 


downloads
Tags:
More
Credit Photo
If you would like to credit the Photo, here are some ways you can do so
Text Link
photo Link
<span class="text-link">
<span>
<a target="_blank" href=https://pikwizard.com/photo/line-graph-data-analytics-overlaid-on-server-room-digital-grid/6ce8fa2738cd7cc5cc242dd401f294c8/>PikWizard</a>
</span>
</span>
<span class="image-link">
<span
style="margin: 0 0 20px 0; display: inline-block; vertical-align: middle; width: 100%;"
>
<a
target="_blank"
href="https://pikwizard.com/photo/line-graph-data-analytics-overlaid-on-server-room-digital-grid/6ce8fa2738cd7cc5cc242dd401f294c8/"
style="text-decoration: none; font-size: 10px; margin: 0;"
>
<img src="https://pikwizard.com/pw/medium/6ce8fa2738cd7cc5cc242dd401f294c8.jpg" style="margin: 0; width: 100%;" alt="" />
<p style="font-size: 12px; margin: 0;">PikWizard</p>
</a>
</span>
</span>
Free (free of charge)
Free for personal and commercial use.
Author: Creative Art
Similar Free Stock Images

Premium


Premium


Premium


Premium


Premium


Premium


Premium

Premium


Premium


Premium


Premium


Premium


Premium


Premium


Premium


Premium

Premium


Premium


Explore More Free Stock Images