
- Home >
- Stock Photos >
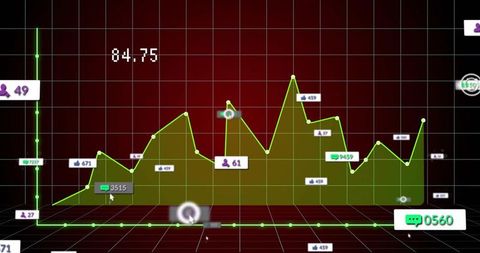
- Line Graph with Data Elements on Purple Grid Interface
Line Graph with Data Elements on Purple Grid Interface Image

Visual representation of statistical data using a segmented line graph with circular markers and bar shapes overlaying a purple grid background. Can be used in presentations, financial reports, or educational contexts to illustrate data trends and analytics visually.
Powered by 


downloads
Tags:
More
Credit Photo
If you would like to credit the Photo, here are some ways you can do so
Text Link
photo Link
<span class="text-link">
<span>
<a target="_blank" href=https://pikwizard.com/photo/line-graph-with-data-elements-on-purple-grid-interface/840861c2bc7d7f9b08860ab408f36c98/>PikWizard</a>
</span>
</span>
<span class="image-link">
<span
style="margin: 0 0 20px 0; display: inline-block; vertical-align: middle; width: 100%;"
>
<a
target="_blank"
href="https://pikwizard.com/photo/line-graph-with-data-elements-on-purple-grid-interface/840861c2bc7d7f9b08860ab408f36c98/"
style="text-decoration: none; font-size: 10px; margin: 0;"
>
<img src="https://pikwizard.com/pw/medium/840861c2bc7d7f9b08860ab408f36c98.jpg" style="margin: 0; width: 100%;" alt="" />
<p style="font-size: 12px; margin: 0;">PikWizard</p>
</a>
</span>
</span>
Free (free of charge)
Free for personal and commercial use.
Author: Awesome Content
Similar Free Stock Images

Premium


Premium

Premium


Premium


Premium


Premium

Premium


Premium


Premium

Premium

Premium

Premium


Premium


Premium

Premium


Premium


Premium


Premium


Premium


Premium


Premium

Premium


Premium


Premium


Premium

Explore More Free Stock Images