- Home >
- Stock Photos >
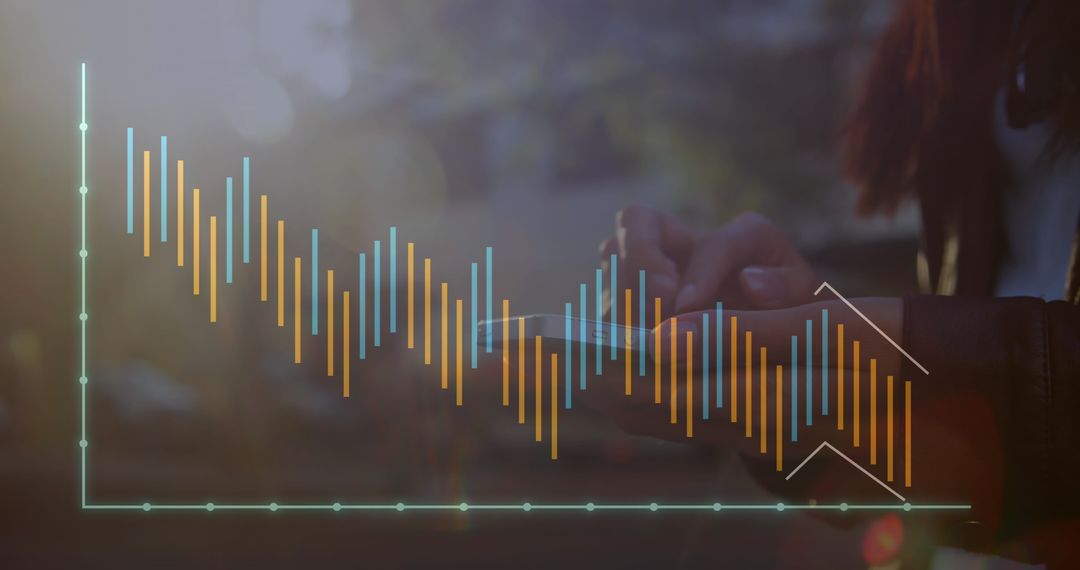
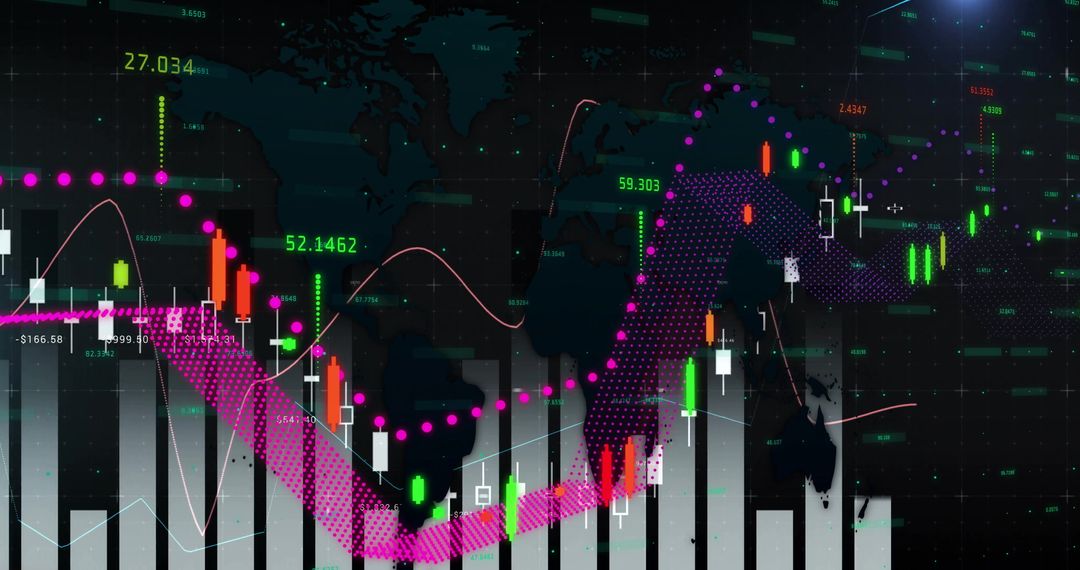
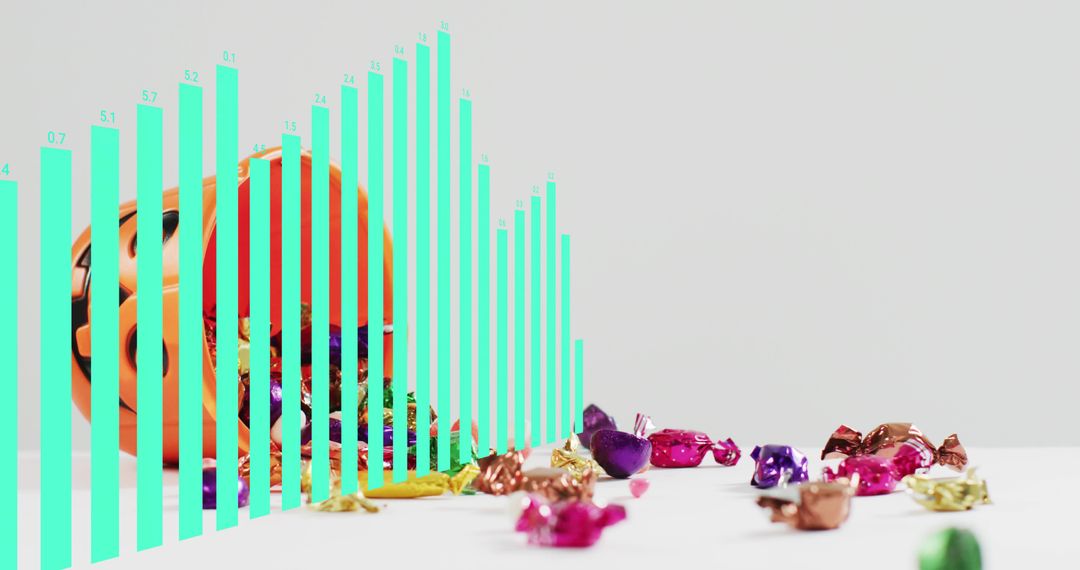
- Magenta Bar Chart Overlaying Rustic Wooden Table with Cutlery and Walnuts
Magenta Bar Chart Overlaying Rustic Wooden Table with Cutlery and Walnuts Image
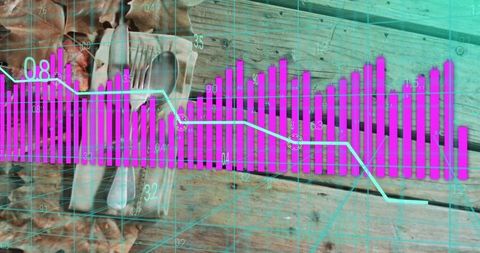
Visual showing magenta bar chart overlaying rustic wooden planks with cutlery and walnuts while cyan trend line traces data pattern across composition. Composition combining bold data overlay with textured woodgrain for modern-meets-rustic contrast. Color palette featuring magenta and cyan against warm wood tones. Suitable for website hero banners, presentation slides, blog headers, social media posts, business reports, restaurant analytics, food industry marketing, seasonal sales reports, menu pricing analysis, farm-to-table branding, infographic backgrounds. Usage suggestions: crop to full-width banner for header, crop tight on utensils and bars for editorial layout, place headline in empty plank area for clear typography. Editing tips: adjust overlay opacity for readability, recoloring bars to match brand palette, adding logo to corner for branding. Licensing note: fitting for commercial and editorial projects needing conceptual data visualization with culinary or rustic themes.
Powered by  - Get 15% off with code: PIKWIZARD15


0
downloads
downloads
Tags:
More
Credit Photo
If you would like to credit the Photo, here are some ways you can do so
Text Link
photo Link
<span class="text-link">
<span>
<a target="_blank" href=https://pikwizard.com/photo/magenta-bar-chart-overlaying-rustic-wooden-table-with-cutlery-and-walnuts/a5d555d00f712bfc8f1977a918abf172/>PikWizard</a>
</span>
</span>
<span class="image-link">
<span
style="margin: 0 0 20px 0; display: inline-block; vertical-align: middle; width: 100%;"
>
<a
target="_blank"
href="https://pikwizard.com/photo/magenta-bar-chart-overlaying-rustic-wooden-table-with-cutlery-and-walnuts/a5d555d00f712bfc8f1977a918abf172/"
style="text-decoration: none; font-size: 10px; margin: 0;"
>
<img src="https://pikwizard.com/pw/medium/a5d555d00f712bfc8f1977a918abf172.jpg" style="margin: 0; width: 100%;" alt="" />
<p style="font-size: 12px; margin: 0;">PikWizard</p>
</a>
</span>
</span>
Free (free of charge)
Free for personal and commercial use.
Author: Awesome Content
Similar Free Stock Images

Premium


Premium


Premium


Premium


Premium


Premium


Premium


Premium


Premium


Premium


Premium


Premium


Premium


Premium


Premium


Premium


Premium


Premium


Premium


Premium


Premium


Premium


Premium


Premium