- Home >
- Stock Photos >
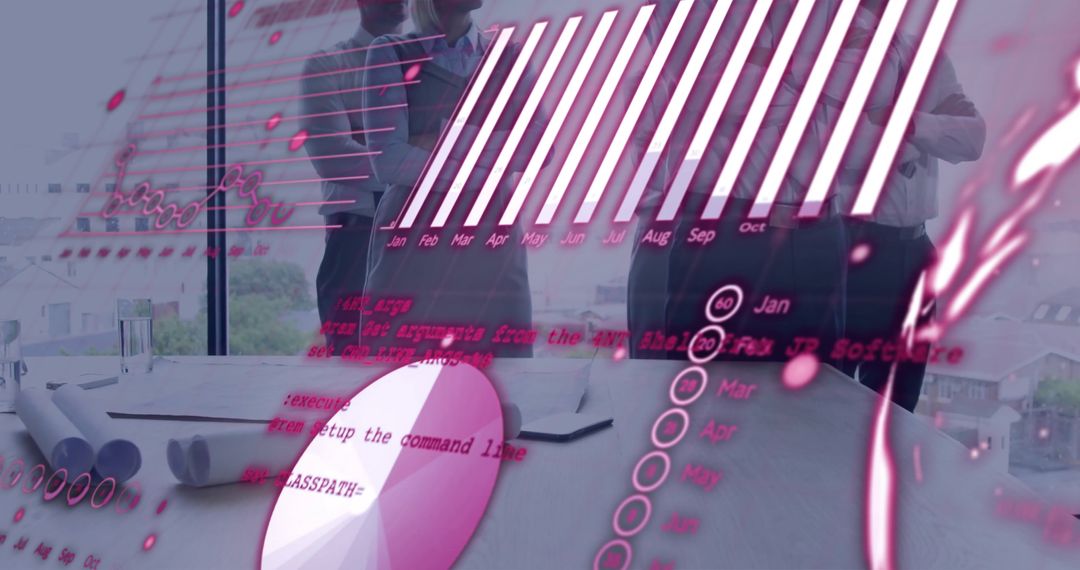
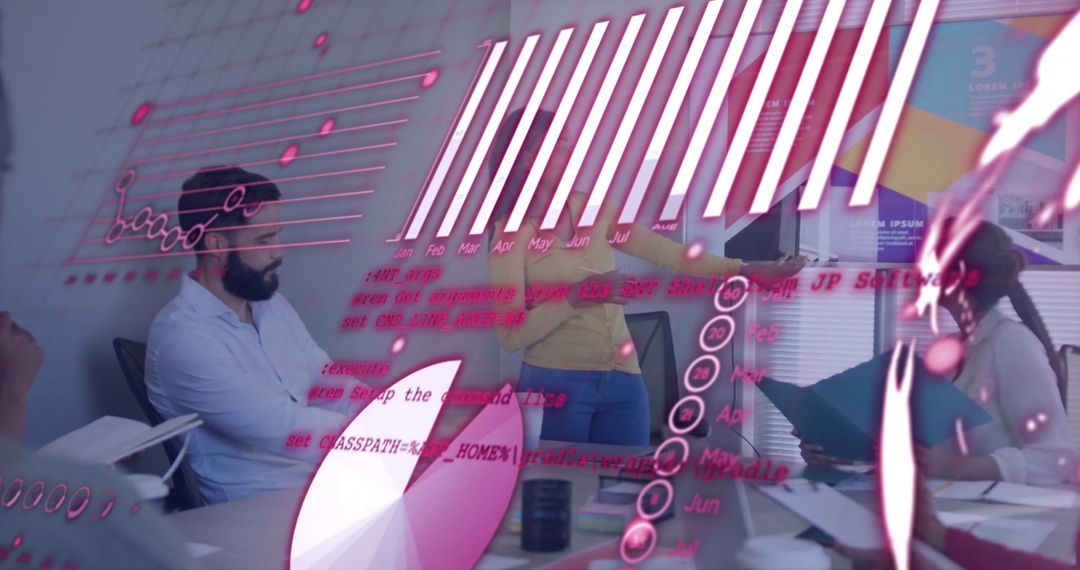
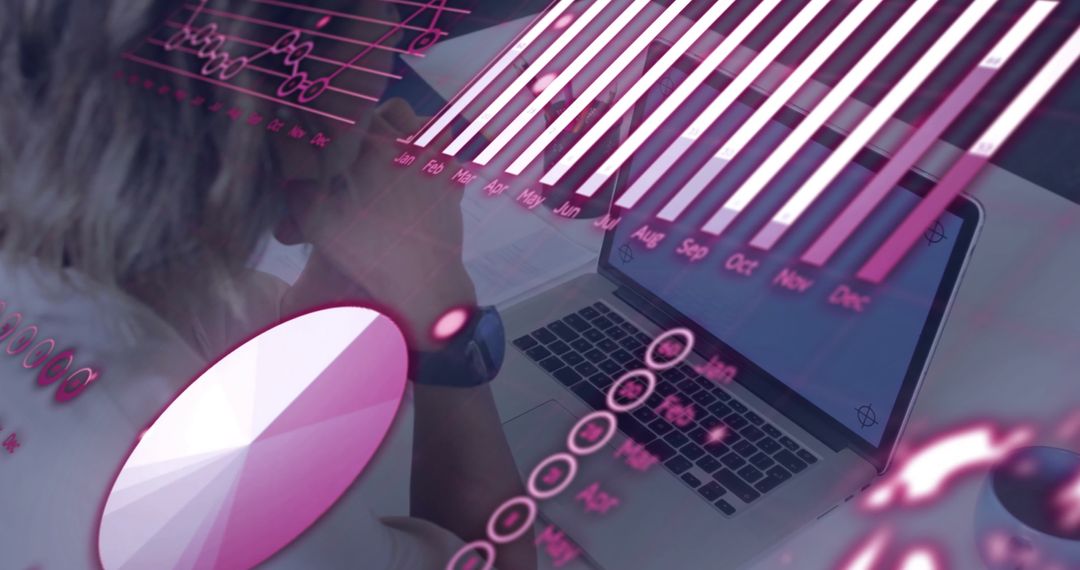
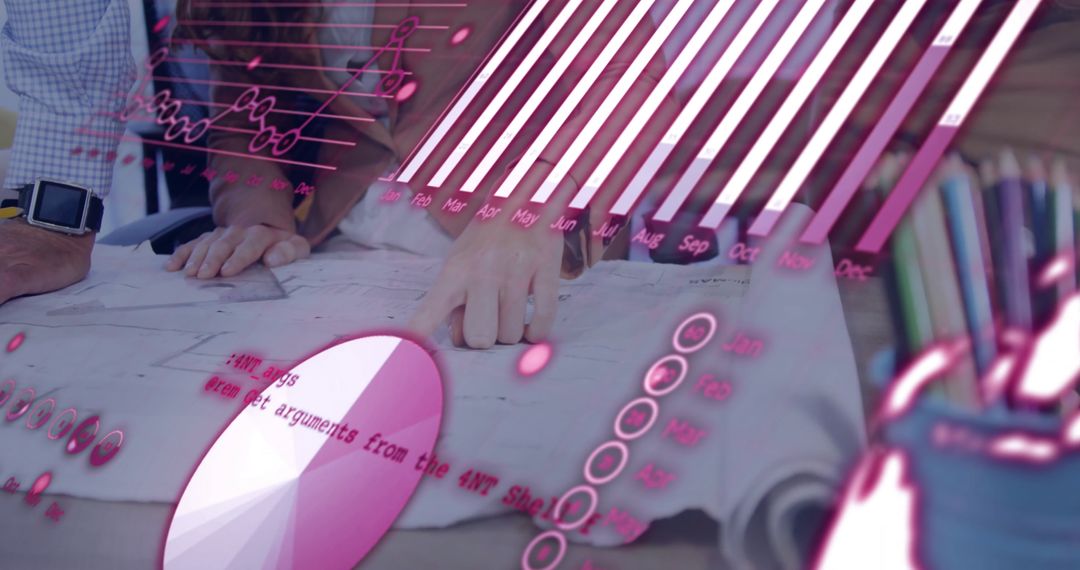
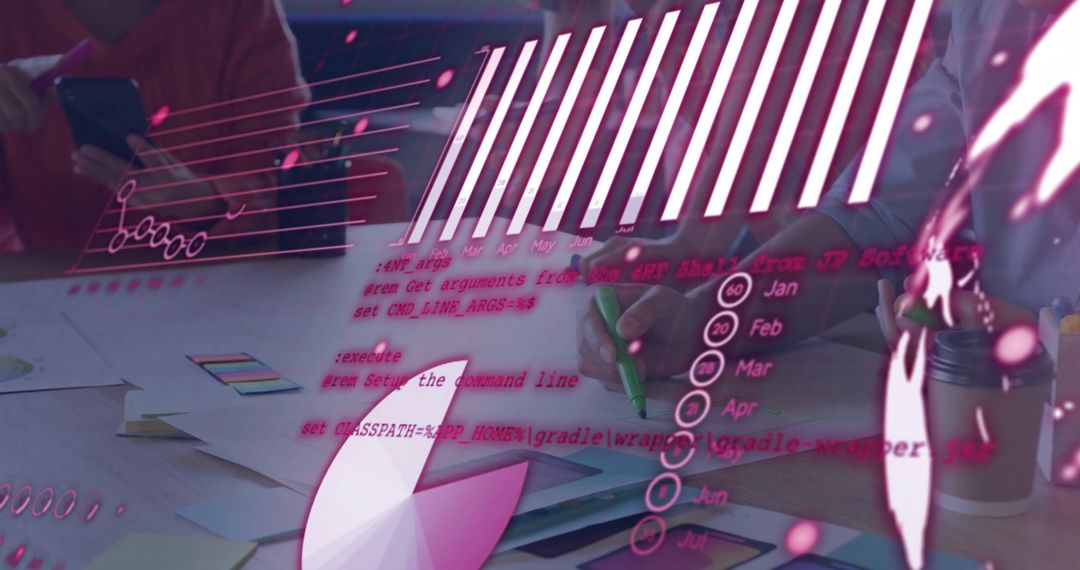
- Male Silhouette Studying Neon Purple Data Dashboards with Tablet, Charts and Code Overlays
Male Silhouette Studying Neon Purple Data Dashboards with Tablet, Charts and Code Overlays Image

High-contrast silhouette of male in dark blazer studying neon purple data dashboards with tablet reflections, pie chart, bar chart and code snippets overlaid. Visual composition combining business analytics, financial metrics and tech aesthetic, highlighting data-driven decision making and modern digital tools. Ideal for tech website hero banners, business analytics blog headers, fintech presentations, investor pitch decks and data science training materials. Useful as background for UX/UI concepts, marketing for analytics software, cyber security campaigns and startup branding. Ample copy space for headline and calls to action, allowing easy integration into layouts and slides.
Powered by 


0
downloads
downloads
Tags:
More
Credit Photo
If you would like to credit the Photo, here are some ways you can do so
Text Link
photo Link
<span class="text-link">
<span>
<a target="_blank" href=https://pikwizard.com/photo/male-silhouette-studying-neon-purple-data-dashboards-with-tablet-charts-and-code-overlays/85b3f690e3bbb82cbc04dbfe74b1d5e9/>PikWizard</a>
</span>
</span>
<span class="image-link">
<span
style="margin: 0 0 20px 0; display: inline-block; vertical-align: middle; width: 100%;"
>
<a
target="_blank"
href="https://pikwizard.com/photo/male-silhouette-studying-neon-purple-data-dashboards-with-tablet-charts-and-code-overlays/85b3f690e3bbb82cbc04dbfe74b1d5e9/"
style="text-decoration: none; font-size: 10px; margin: 0;"
>
<img src="https://pikwizard.com/pw/medium/85b3f690e3bbb82cbc04dbfe74b1d5e9.jpg" style="margin: 0; width: 100%;" alt="" />
<p style="font-size: 12px; margin: 0;">PikWizard</p>
</a>
</span>
</span>
Free (free of charge)
Free for personal and commercial use.
Author: Authentic Images
Similar Free Stock Images

Premium


Premium


Premium


Premium


Premium


Premium


Premium


Premium


Premium


Premium


Premium


Premium


Premium


Premium


Premium


Premium


Premium


Premium


Premium


Premium


Premium


Premium


Premium


Premium