- Home >
- Stock Photos >
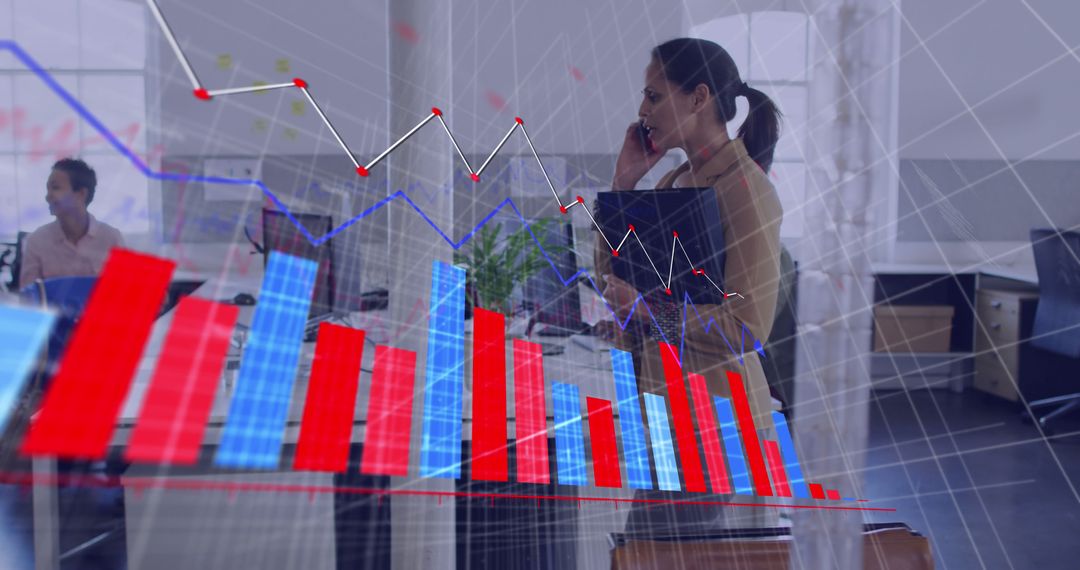
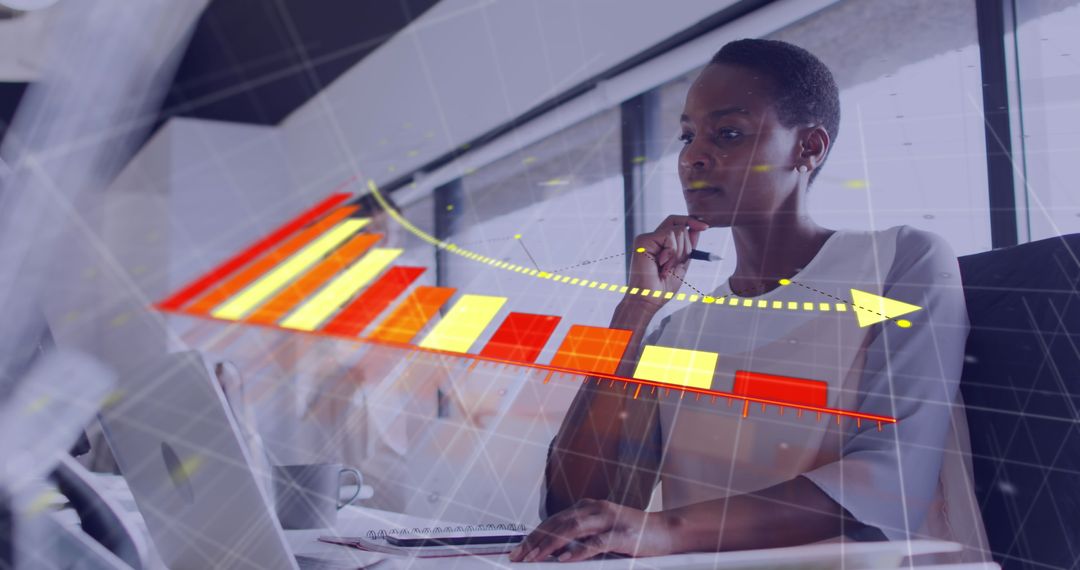
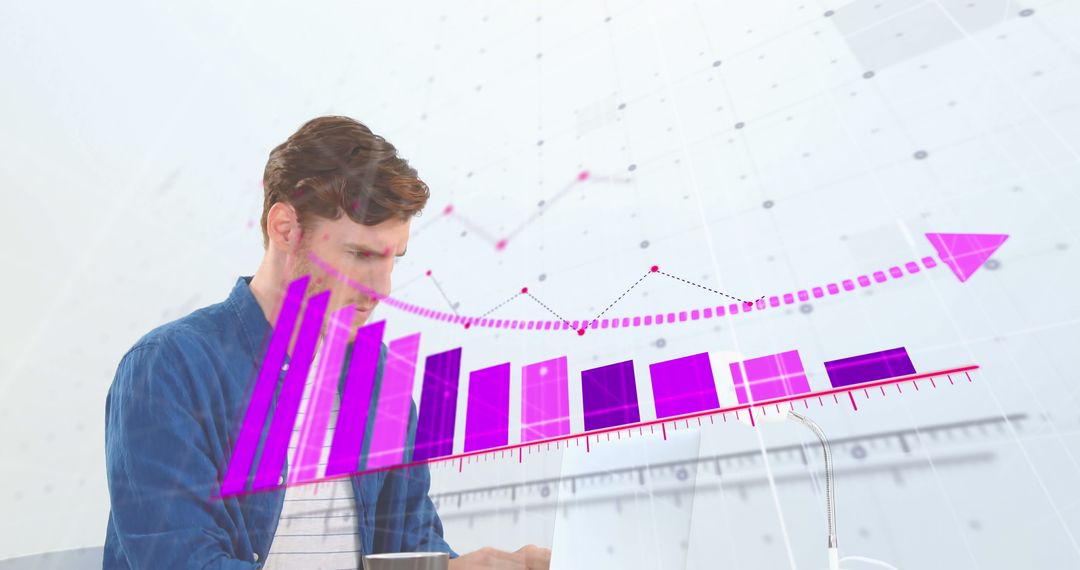
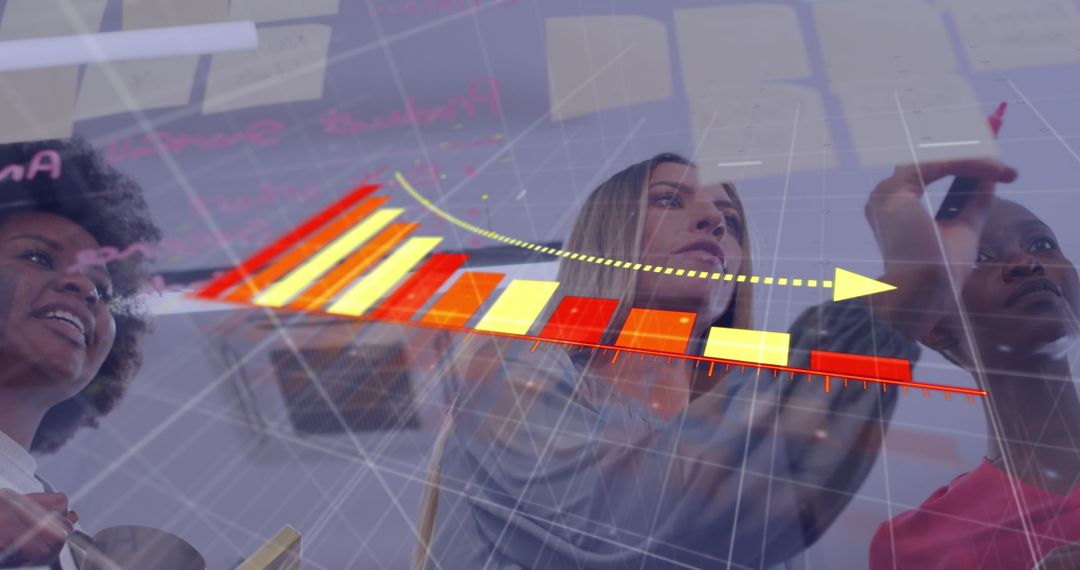
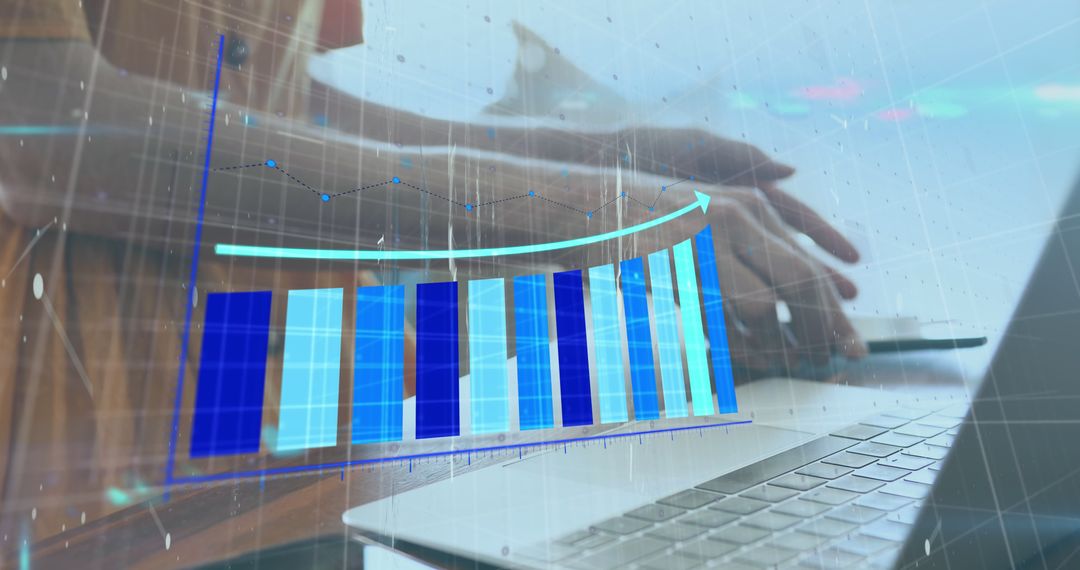
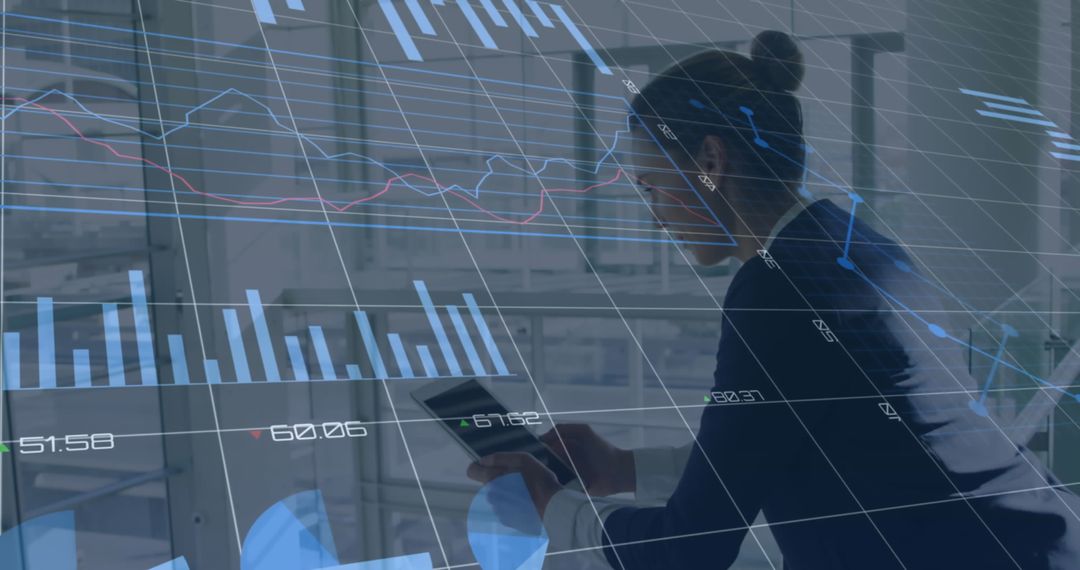
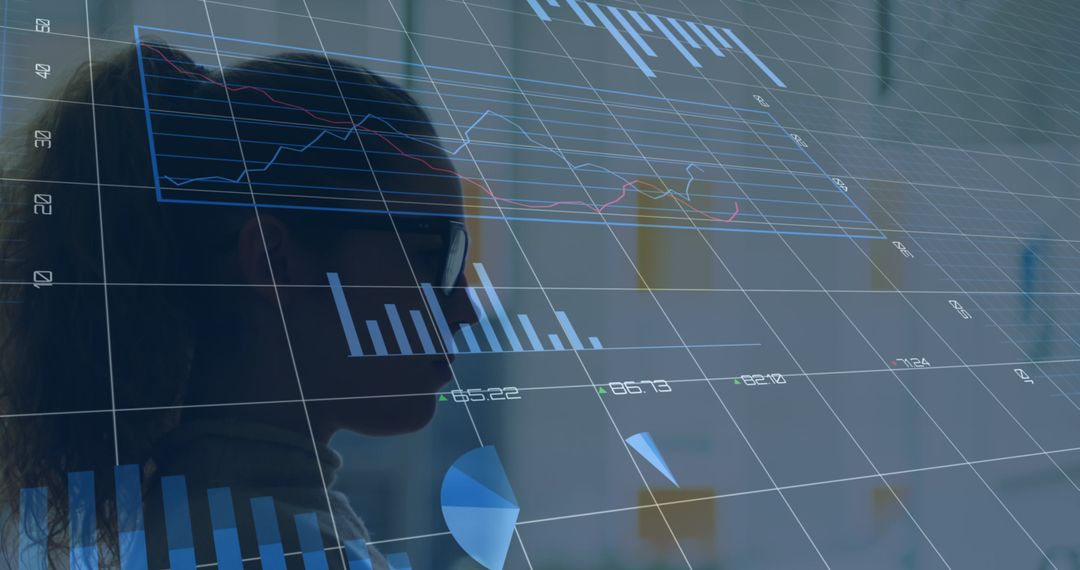
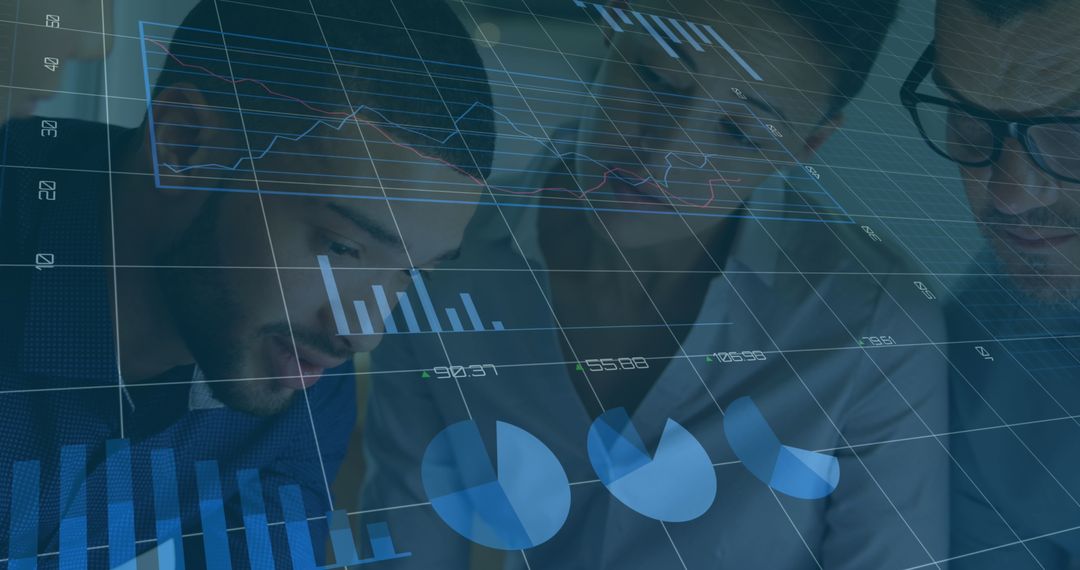
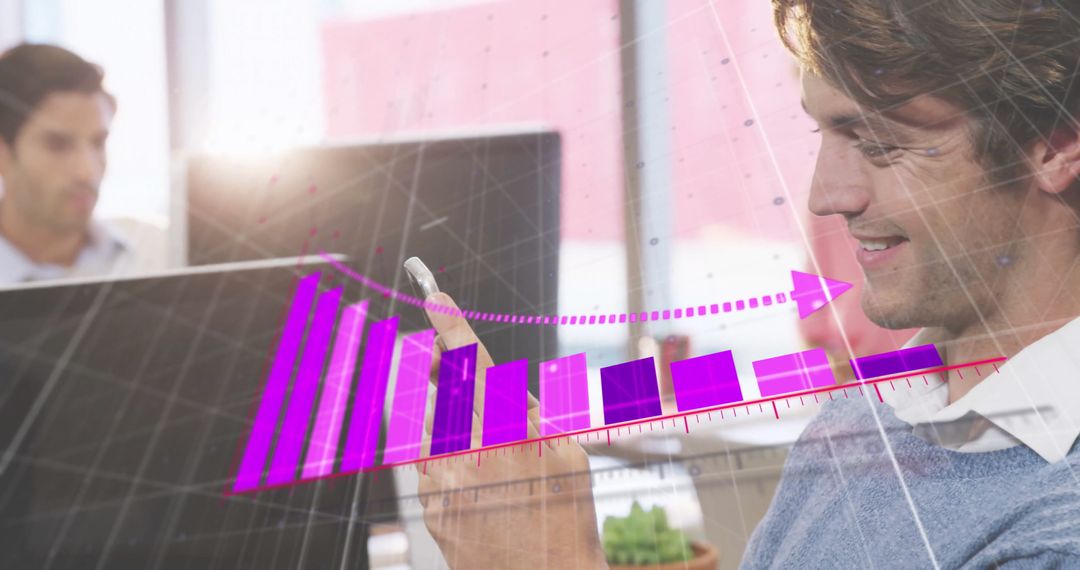
- Man Analyzing Data on Laptop with Upward Business Graph Overlay
Man Analyzing Data on Laptop with Upward Business Graph Overlay Image

This visual represents a dedicated professional working on important data, illustrating digital transformation and business growth through a futuristic, upward-trending graph overlay. Ideal for topics related to data analysis, business success, technological advancement, or workplace innovation. It can be used on business presentations, financial reports, technology blogs, and corporate websites to convey strategic growth and analytical foresight.
Powered by  - Get 15% off with code: PIKWIZARD15


0
downloads
downloads
Tags:
More
Credit Photo
If you would like to credit the Photo, here are some ways you can do so
Text Link
photo Link
<span class="text-link">
<span>
<a target="_blank" href=https://pikwizard.com/photo/man-analyzing-data-on-laptop-with-upward-business-graph-overlay/df9c378cbbba91ce2c03ea8f326158bf/>PikWizard</a>
</span>
</span>
<span class="image-link">
<span
style="margin: 0 0 20px 0; display: inline-block; vertical-align: middle; width: 100%;"
>
<a
target="_blank"
href="https://pikwizard.com/photo/man-analyzing-data-on-laptop-with-upward-business-graph-overlay/df9c378cbbba91ce2c03ea8f326158bf/"
style="text-decoration: none; font-size: 10px; margin: 0;"
>
<img src="https://pikwizard.com/pw/medium/df9c378cbbba91ce2c03ea8f326158bf.jpg" style="margin: 0; width: 100%;" alt="" />
<p style="font-size: 12px; margin: 0;">PikWizard</p>
</a>
</span>
</span>
Free (free of charge)
Free for personal and commercial use.
Author: Authentic Images
Similar Free Stock Images

Premium


Premium


Premium


Premium


Premium


Premium


Premium


Premium


Premium


Premium


Premium


Premium


Premium


Premium


Premium


Premium


Premium


Premium


Premium


Premium


Premium


Premium


Premium


Premium