- Home >
- Stock Photos >
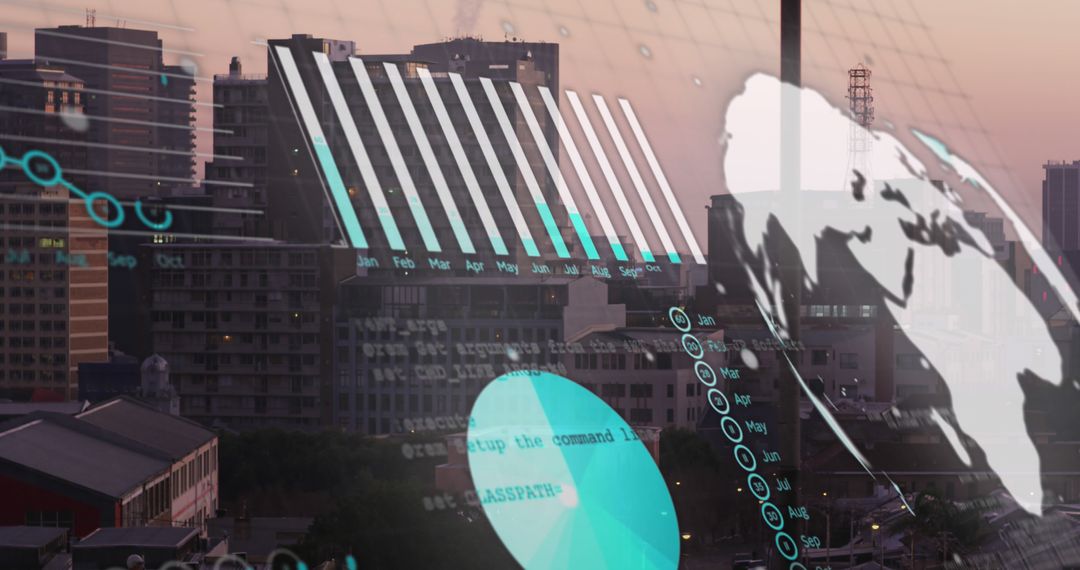
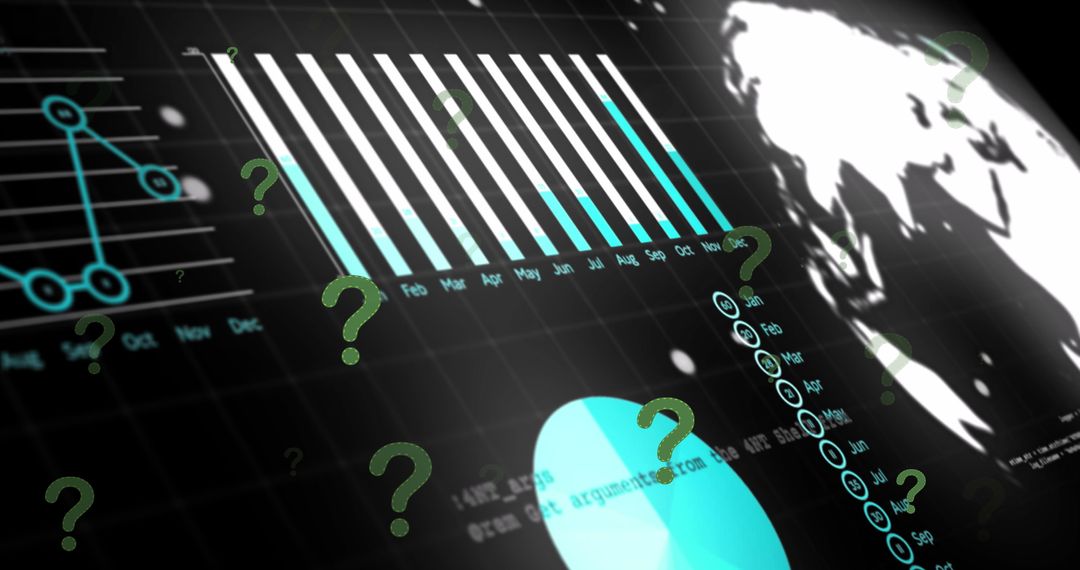
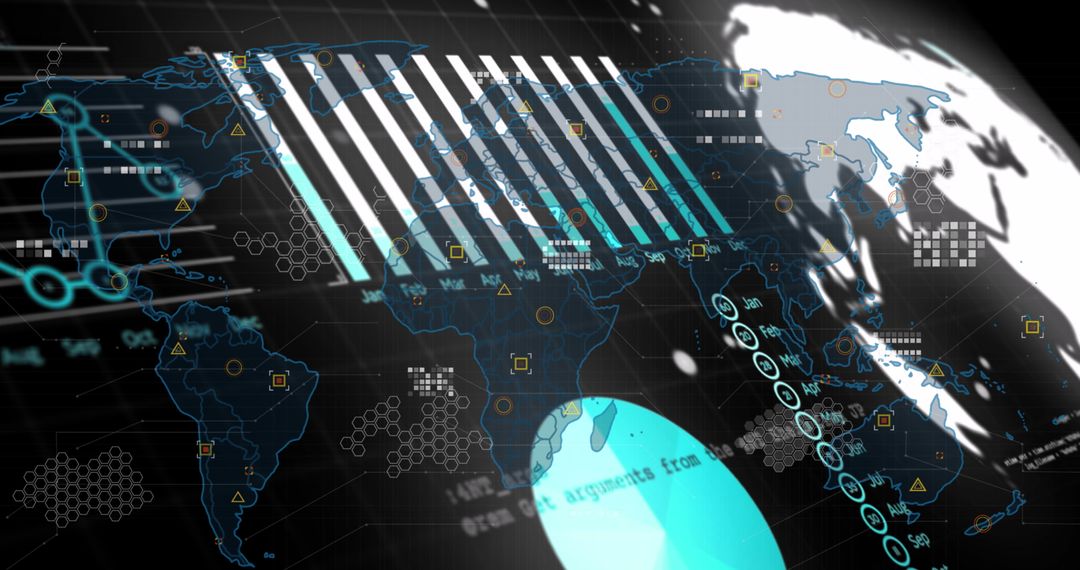
- Man analyzing holographic data dashboard with global map and teal analytics overlays
Man analyzing holographic data dashboard with global map and teal analytics overlays Image

Showing man in white shirt and suspenders interacting with holographic charts and glowing global map, conveying data-driven decision making and strategic planning. Featuring layered bar chart, pie chart and timeline elements with teal accent color for modern tech aesthetic. Serving content needs for corporate presentations, software landing pages, business intelligence reports, fintech campaigns, technology blogs and training modules. Working well as full-bleed hero visual, cropped social media asset, hero banner or background for headlines about analytics, big data and digital transformation. Supporting use in UI concept demonstrations, investor decks, marketing collateral and editorial on technology trends.
Powered by 


0
downloads
downloads
Tags:
More
Credit Photo
If you would like to credit the Photo, here are some ways you can do so
Text Link
photo Link
<span class="text-link">
<span>
<a target="_blank" href=https://pikwizard.com/photo/man-analyzing-holographic-data-dashboard-with-global-map-and-teal-analytics-overlays/65359d6a16e70ee190aeb6674f15b32e/>PikWizard</a>
</span>
</span>
<span class="image-link">
<span
style="margin: 0 0 20px 0; display: inline-block; vertical-align: middle; width: 100%;"
>
<a
target="_blank"
href="https://pikwizard.com/photo/man-analyzing-holographic-data-dashboard-with-global-map-and-teal-analytics-overlays/65359d6a16e70ee190aeb6674f15b32e/"
style="text-decoration: none; font-size: 10px; margin: 0;"
>
<img src="https://pikwizard.com/pw/medium/65359d6a16e70ee190aeb6674f15b32e.jpg" style="margin: 0; width: 100%;" alt="" />
<p style="font-size: 12px; margin: 0;">PikWizard</p>
</a>
</span>
</span>
Free (free of charge)
Free for personal and commercial use.
Author: Creative Art
Similar Free Stock Images

Premium


Premium


Premium


Premium


Premium


Premium


Premium


Premium


Premium


Premium


Premium


Premium


Premium


Premium


Premium


Premium


Premium


Premium


Premium


Premium


Premium


Premium


Premium


Premium