
- Home >
- Stock Photos >
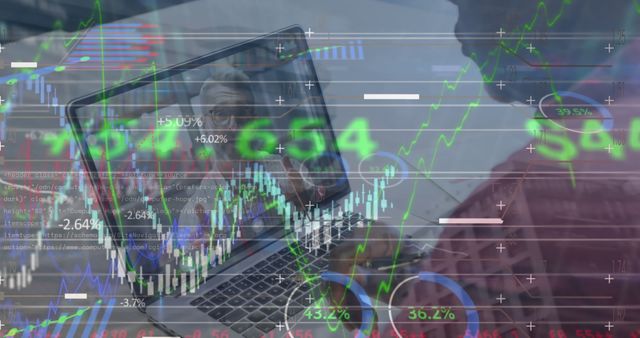
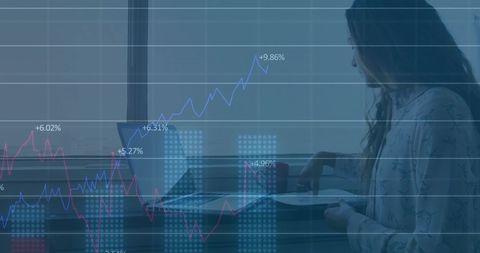
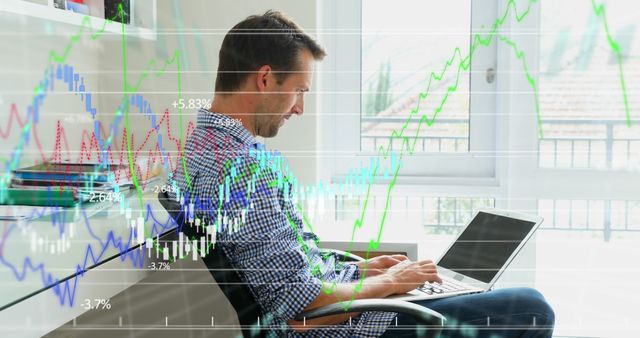
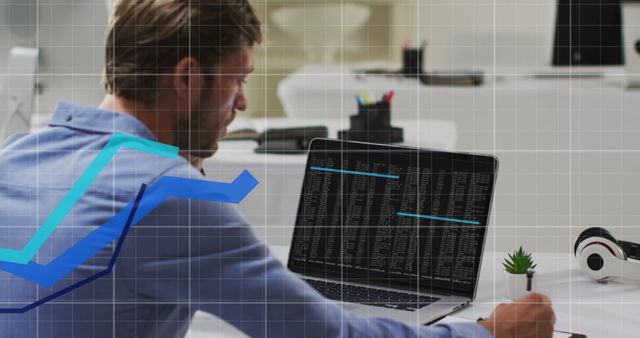
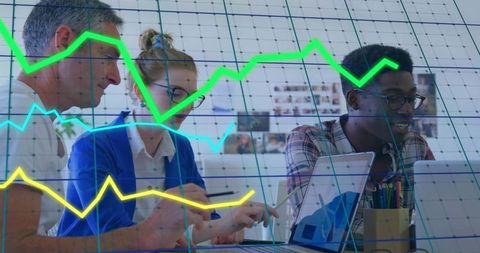
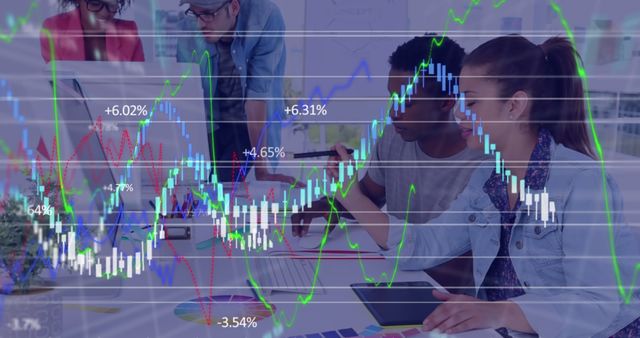
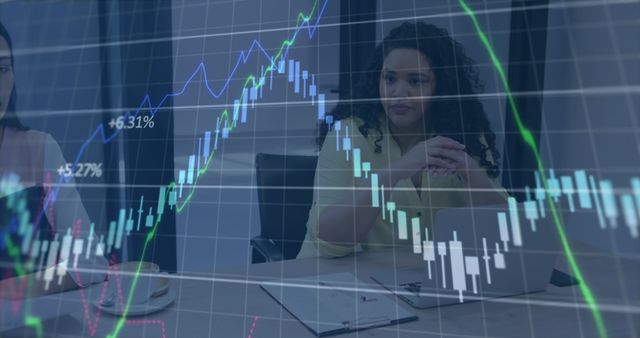
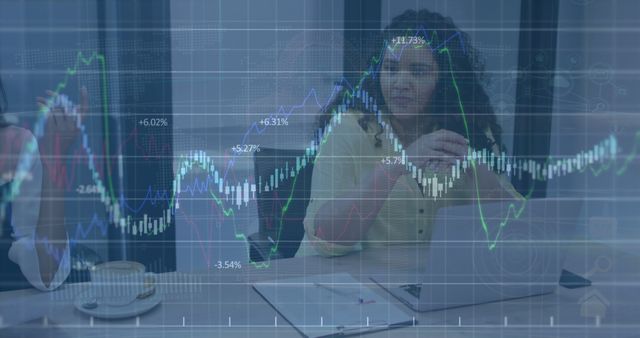
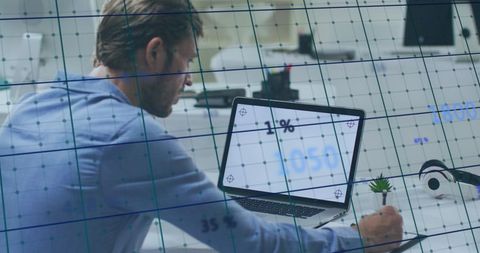
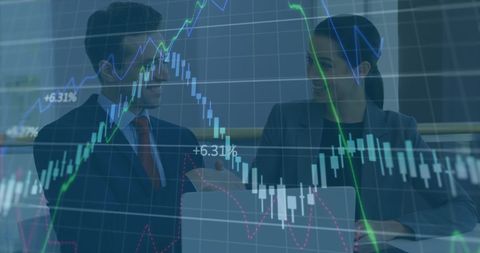
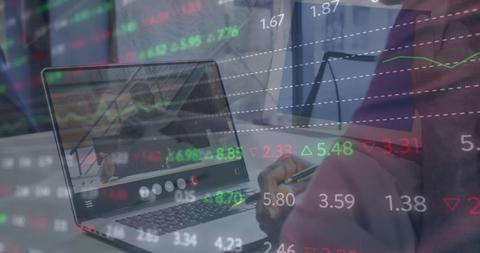
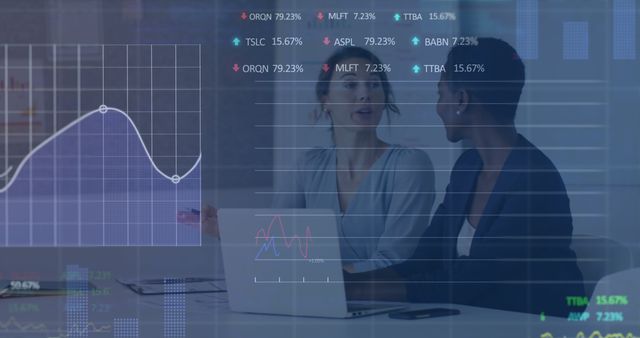
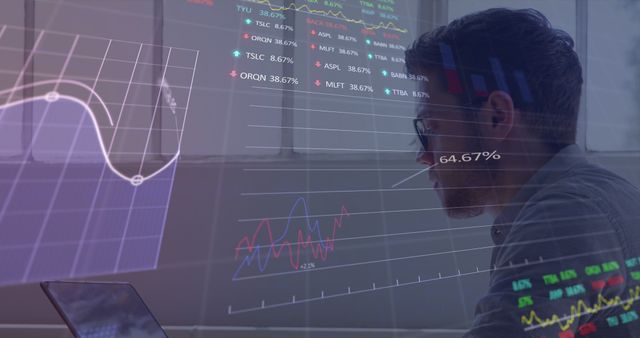
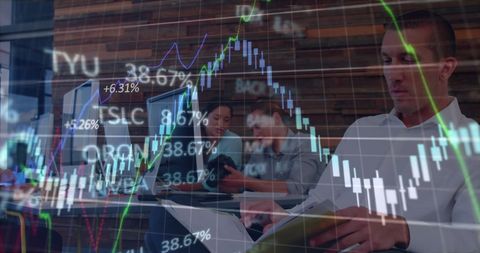
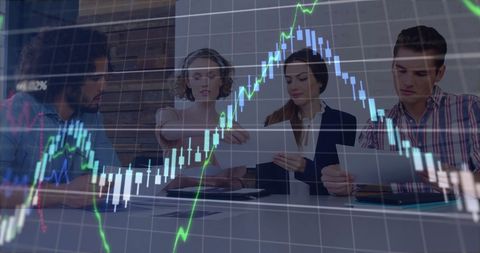
- Man Analyzing Stock Market Data on Laptop in Office Environment
Man Analyzing Stock Market Data on Laptop in Office Environment Image

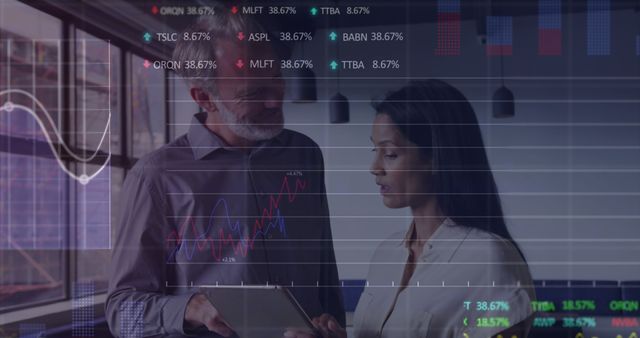
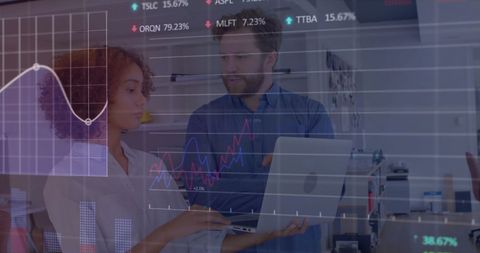
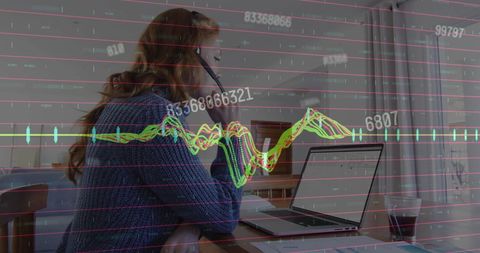
Visualizing global economy and stock market trends conceptualized through graphical overlays against a man using a laptop in an office. Suitable for articles or presentations about financial analysis, stock market consulting, or economic forecasting.
Powered by  - Get 15% off with code: PIKWIZARD15


2
downloads
downloads
Tags:
More
Credit Photo
If you would like to credit the Photo, here are some ways you can do so
Text Link
photo Link
<span class="text-link">
<span>
<a target="_blank" href=https://pikwizard.com/photo/man-analyzing-stock-market-data-on-laptop-in-office-environment/18699ae146397c31469411fd3e540229/>PikWizard</a>
</span>
</span>
<span class="image-link">
<span
style="margin: 0 0 20px 0; display: inline-block; vertical-align: middle; width: 100%;"
>
<a
target="_blank"
href="https://pikwizard.com/photo/man-analyzing-stock-market-data-on-laptop-in-office-environment/18699ae146397c31469411fd3e540229/"
style="text-decoration: none; font-size: 10px; margin: 0;"
>
<img src="https://pikwizard.com/pw/medium/18699ae146397c31469411fd3e540229.jpg" style="margin: 0; width: 100%;" alt="" />
<p style="font-size: 12px; margin: 0;">PikWizard</p>
</a>
</span>
</span>
Free (free of charge)
Free for personal and commercial use.
Author: Awesome Content
Similar Free Stock Images
Loading...

Premium

Premium


Premium


Premium


Premium

Premium


Premium

Premium


Premium


Premium


Premium


Premium

Premium

Premium

Premium


Premium


Premium


Premium


Premium

Premium


Premium


Premium


Premium


Premium


Premium
