- Home >
- Stock Photos >
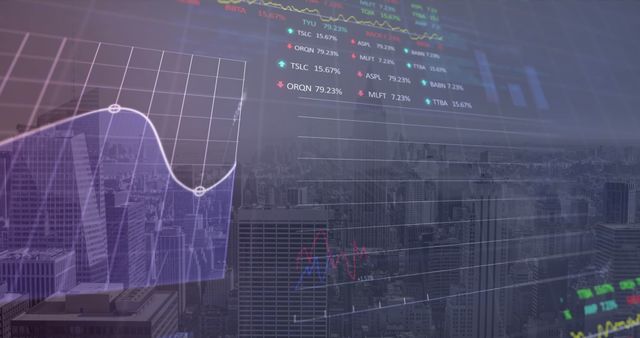
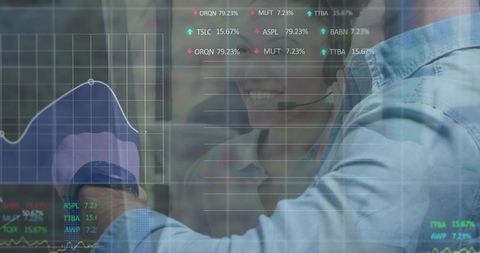
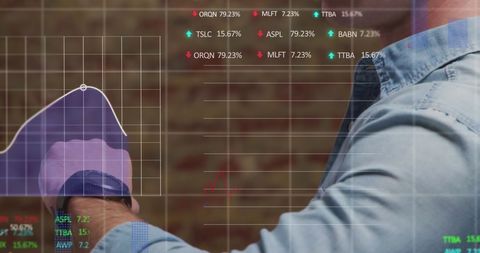
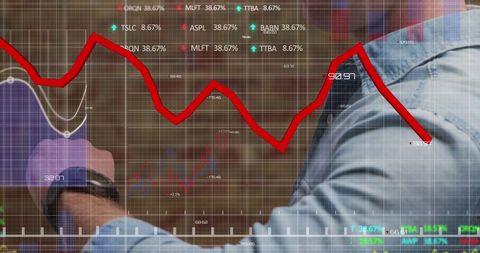
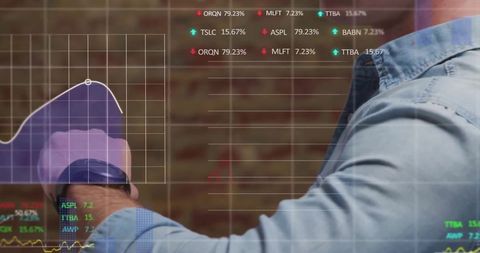
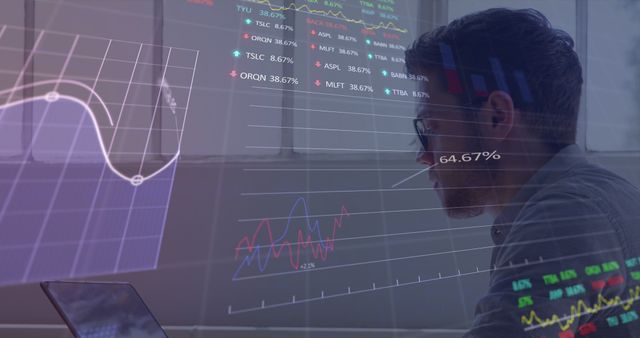
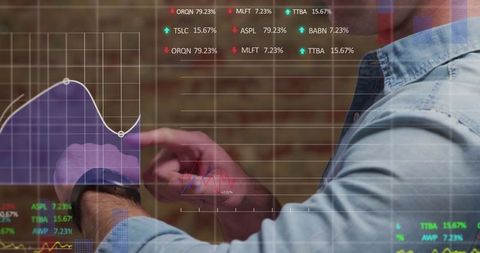
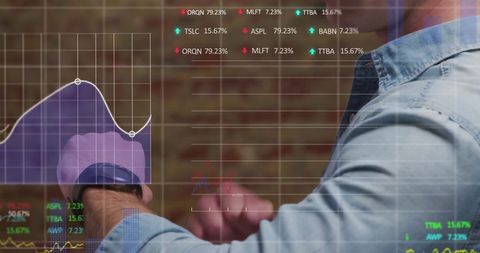
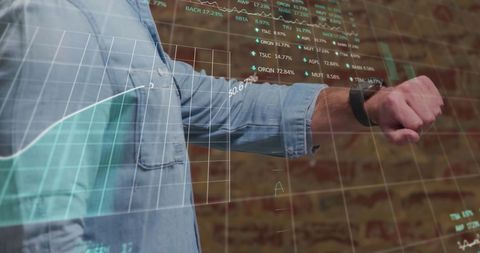
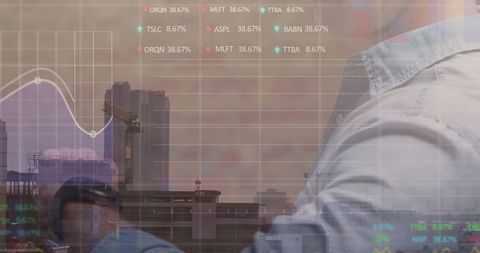
- Man Engaging with Innovative Financial Data Visualization
Man Engaging with Innovative Financial Data Visualization Image

A man in a blue shirt, enthusiastically raising a clenched fist while examining various digital financial charts projected in front. This scene signifies the triumph and excitement in effectively utilizing financial technology for business success. The interplay of man and data graphics communicates a theme of innovation in the intersection of business and digital transformation. Ideal for representing themes surrounding financial strategies, modern business environments, tech-driven solutions, or conveying futuristic corporate settings.

downloads
Tags:
More
Credit Photo
If you would like to credit the Photo, here are some ways you can do so
Text Link
photo Link
<span class="text-link">
<span>
<a target="_blank" href=https://pikwizard.com/photo/man-engaging-with-innovative-financial-data-visualization/70cc822744075ccf9813933b0a6dbc7a/>PikWizard</a>
</span>
</span>
<span class="image-link">
<span
style="margin: 0 0 20px 0; display: inline-block; vertical-align: middle; width: 100%;"
>
<a
target="_blank"
href="https://pikwizard.com/photo/man-engaging-with-innovative-financial-data-visualization/70cc822744075ccf9813933b0a6dbc7a/"
style="text-decoration: none; font-size: 10px; margin: 0;"
>
<img src="https://pikwizard.com/pw/medium/70cc822744075ccf9813933b0a6dbc7a.jpg" style="margin: 0; width: 100%;" alt="" />
<p style="font-size: 12px; margin: 0;">PikWizard</p>
</a>
</span>
</span>
Free (free of charge)
Free for personal and commercial use.
Author: People Creations