
- Home >
- Stock Photos >
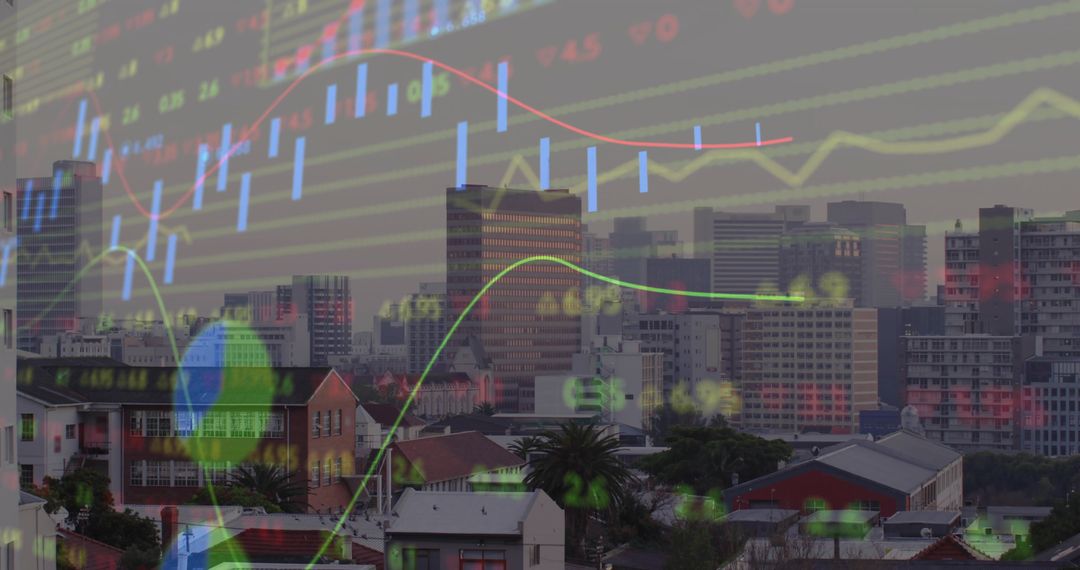
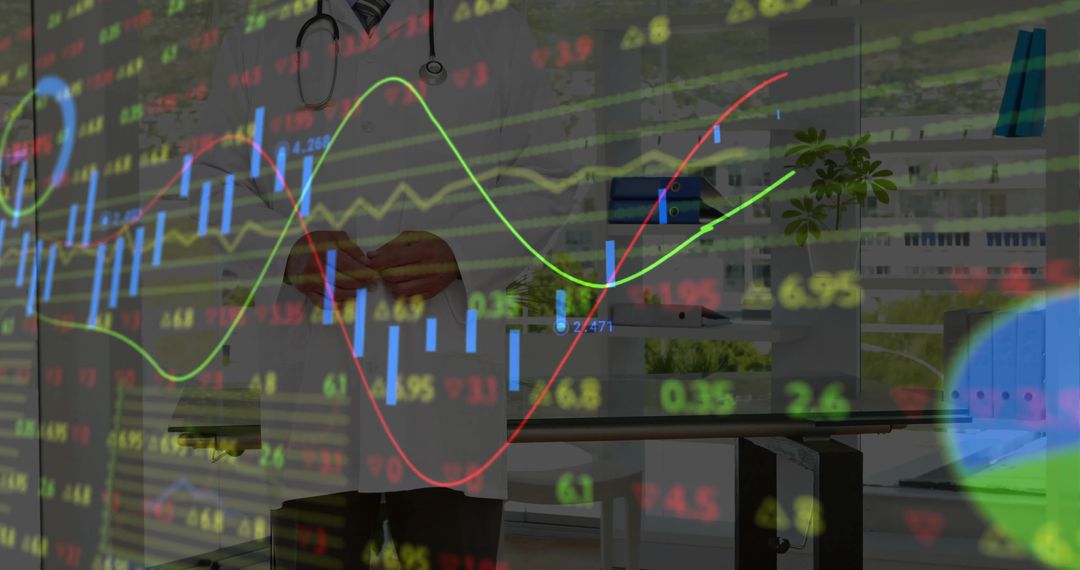
- Man with glasses studying transparent market data overlay with trading charts and candlesticks
Man with glasses studying transparent market data overlay with trading charts and candlesticks Image

Man with glasses studying transparent market data overlay with candlestick bars, line graphs, and numeric tickers. Composition creating sense of focus, analytical thinking, and modern fintech workflow. Ideal for fintech websites, investment firm presentations, financial reports, business blog headers, pitch decks, mobile app interfaces, and marketing materials. Transparent data overlay allowing easy placement of text and branding while preserving dramatic portrait detail. Color tones and wide aspect supporting web hero banners and social media posts. Cropping suggestions: landscape for website header, square for social feed, vertical for print adverts.
Powered by  - Get 15% off with code: PIKWIZARD15


0
downloads
downloads
Tags:
More
Credit Photo
If you would like to credit the Photo, here are some ways you can do so
Text Link
photo Link
<span class="text-link">
<span>
<a target="_blank" href=https://pikwizard.com/photo/man-with-glasses-studying-transparent-market-data-overlay-with-trading-charts-and-candlesticks/62d629a7be28f91de84d8401cc0b36ba/>PikWizard</a>
</span>
</span>
<span class="image-link">
<span
style="margin: 0 0 20px 0; display: inline-block; vertical-align: middle; width: 100%;"
>
<a
target="_blank"
href="https://pikwizard.com/photo/man-with-glasses-studying-transparent-market-data-overlay-with-trading-charts-and-candlesticks/62d629a7be28f91de84d8401cc0b36ba/"
style="text-decoration: none; font-size: 10px; margin: 0;"
>
<img src="https://pikwizard.com/pw/medium/62d629a7be28f91de84d8401cc0b36ba.jpg" style="margin: 0; width: 100%;" alt="" />
<p style="font-size: 12px; margin: 0;">PikWizard</p>
</a>
</span>
</span>
Free (free of charge)
Free for personal and commercial use.
Author: People Creations
Similar Free Stock Images

Premium


Premium


Premium


Premium


Premium


Premium


Premium


Premium


Premium


Premium


Premium


Premium


Premium


Premium


Premium


Premium


Premium


Premium


Premium


Premium


Premium


Premium


Premium


Premium

