- Home >
- Stock Photos >
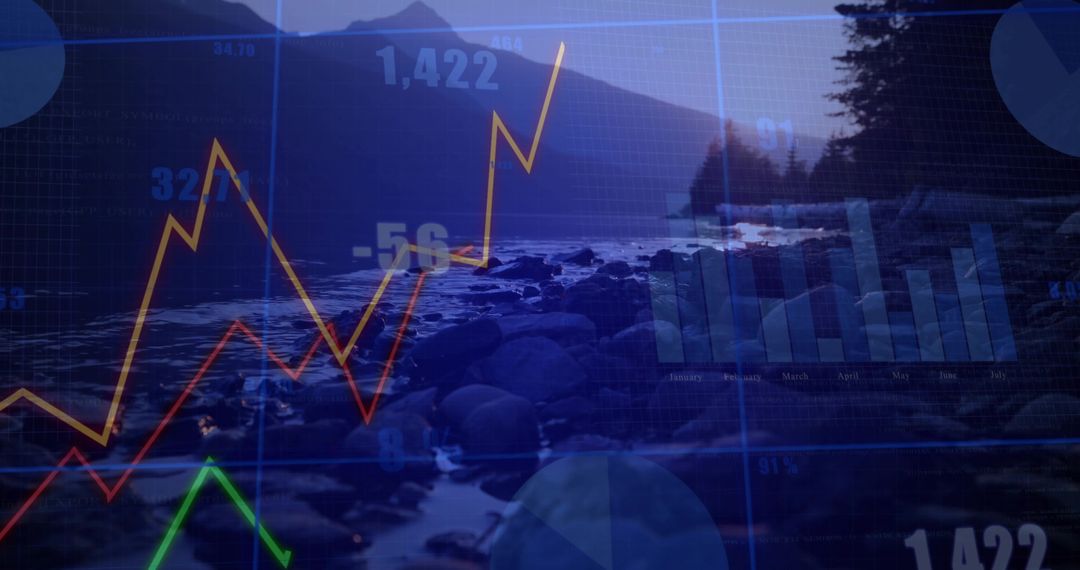
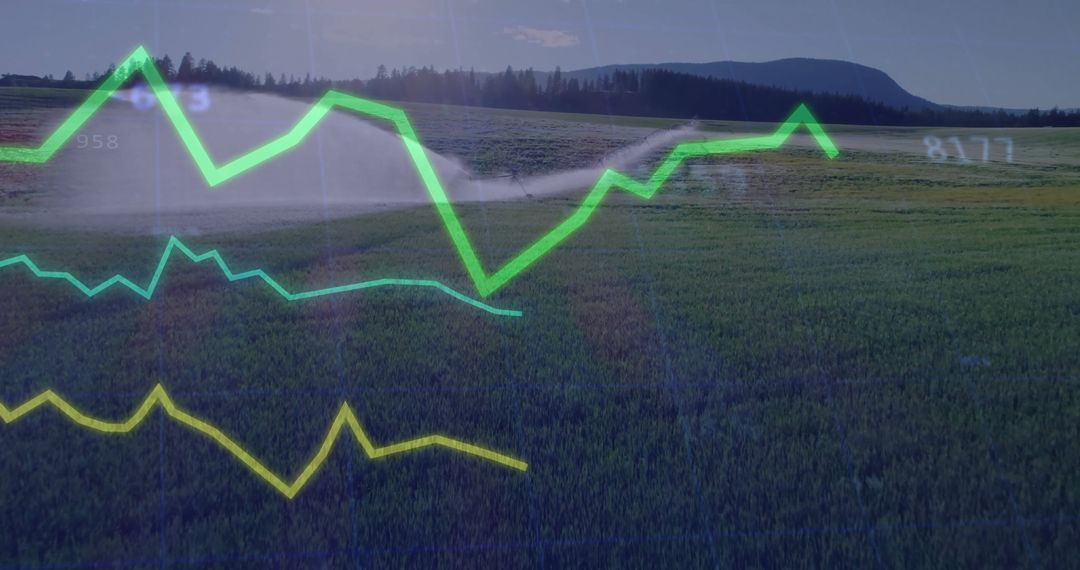
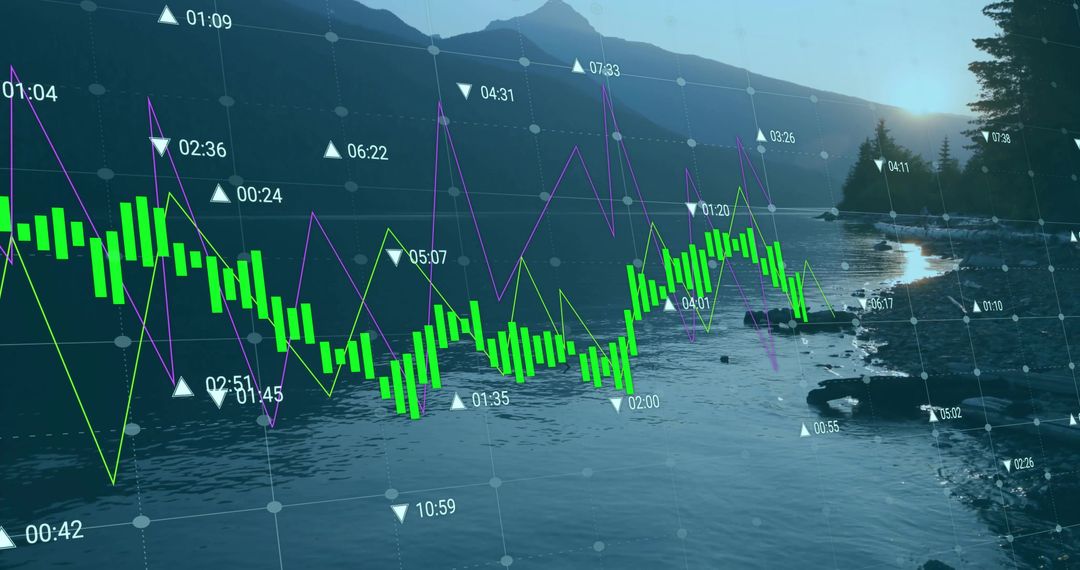
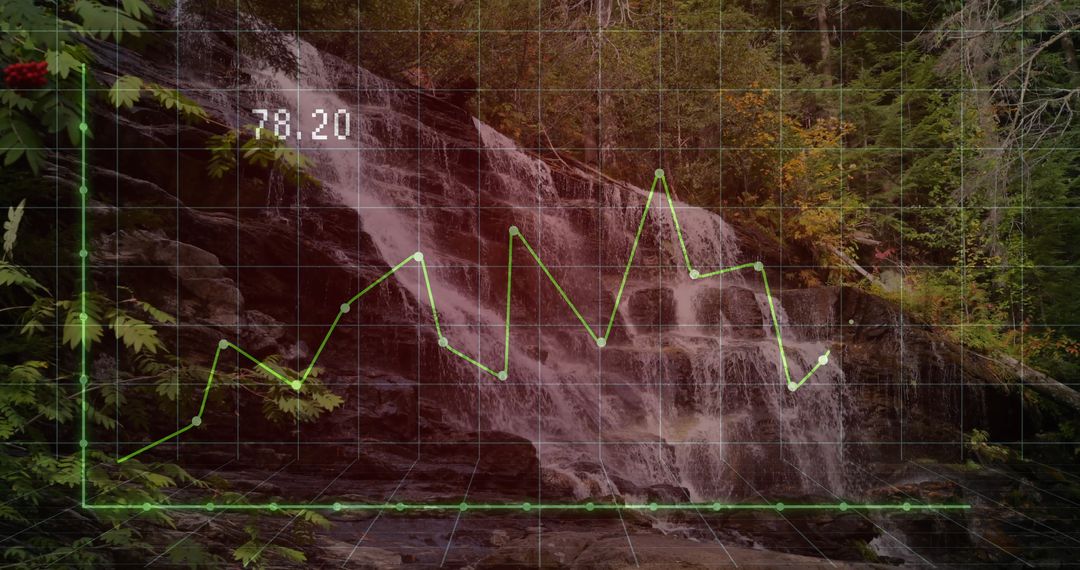
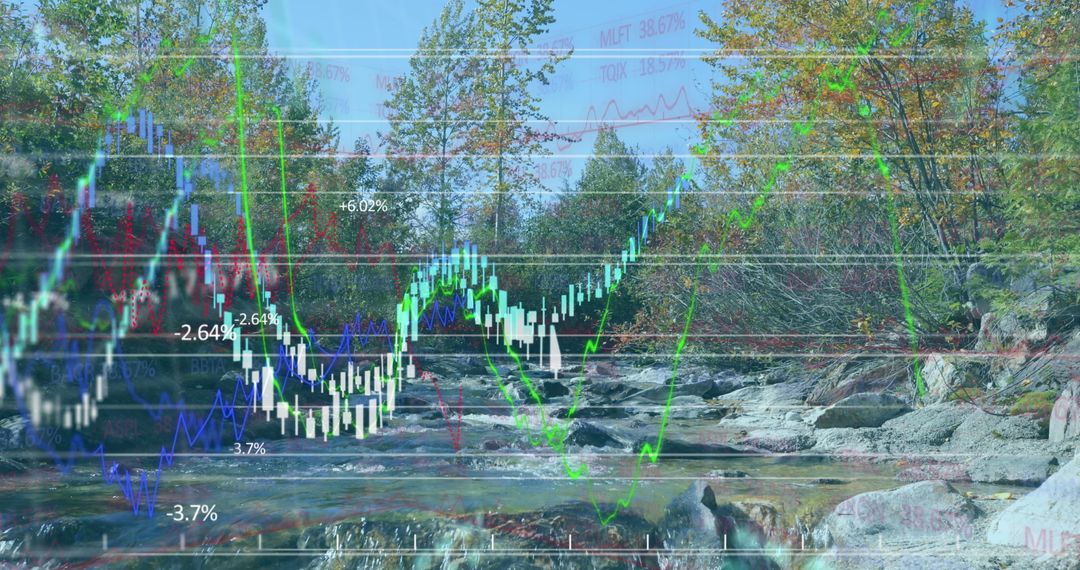
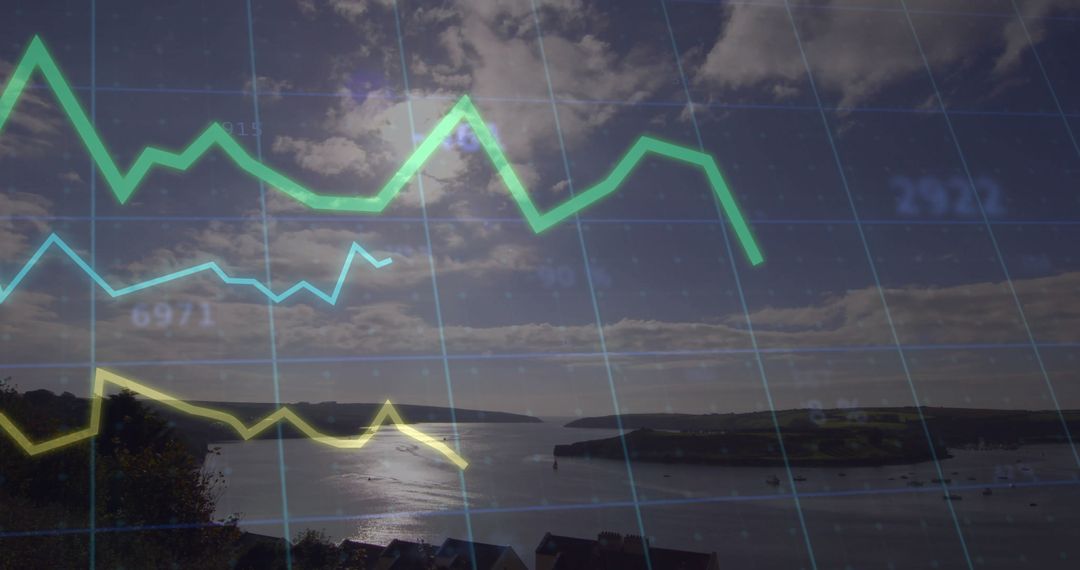
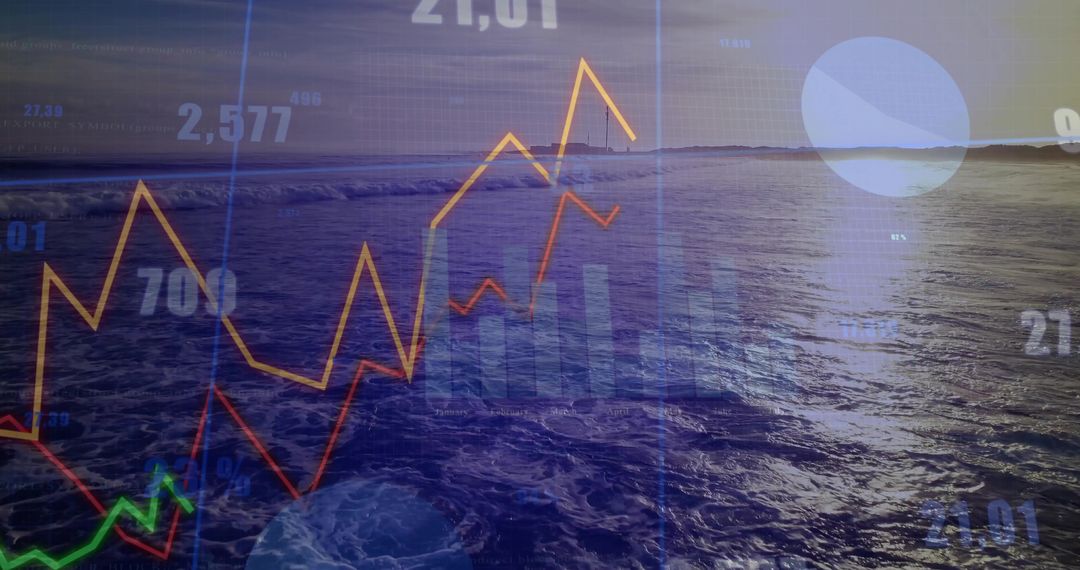
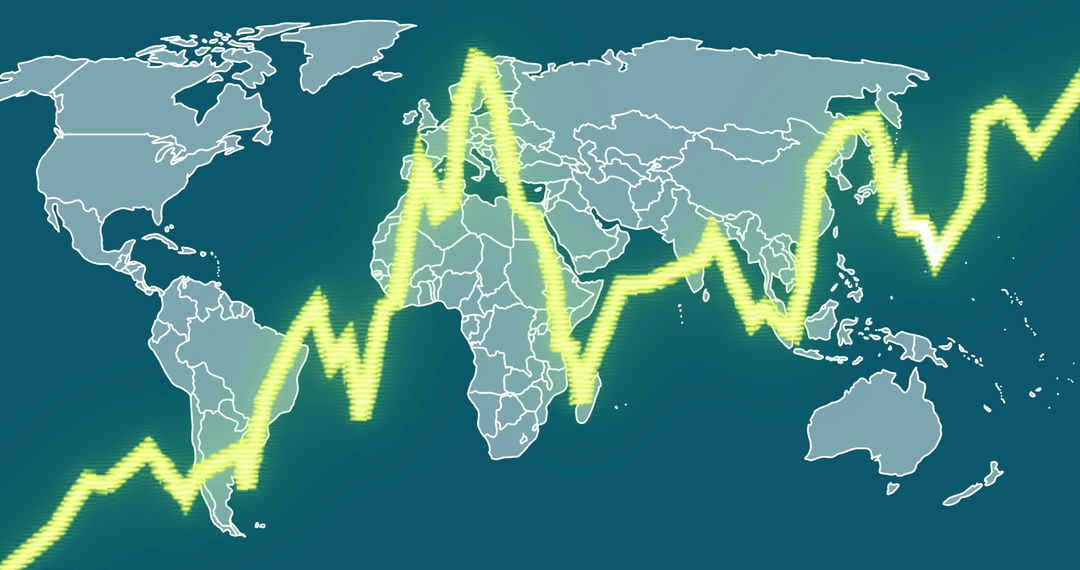
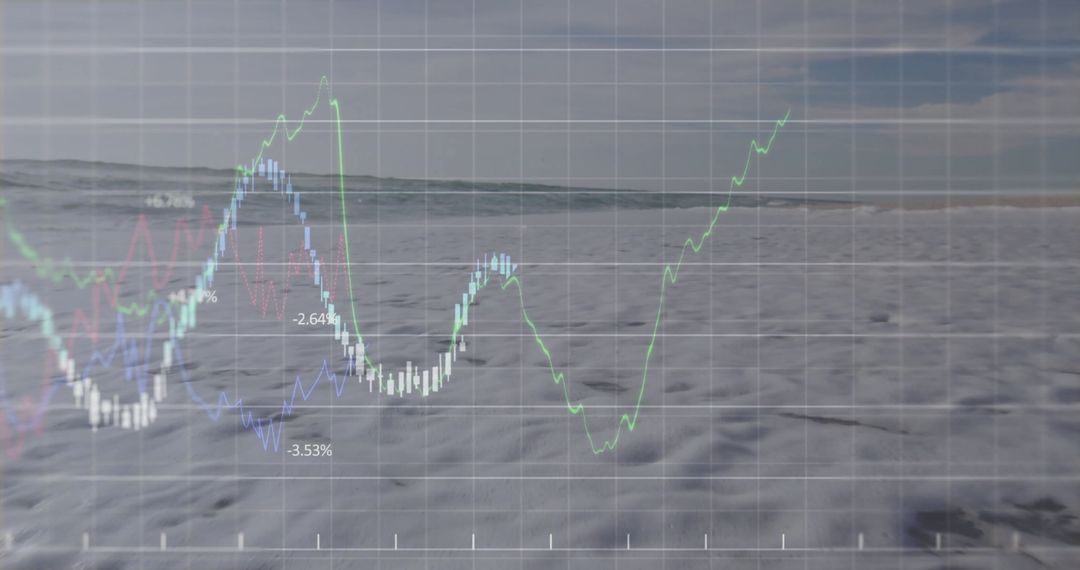
- Maritime Financial Data Visualization Concept with Line Graphs and Sea
Maritime Financial Data Visualization Concept with Line Graphs and Sea Image

Graph elements alongside sea visual create an abstract representation of maritime financial figures. Multiple graph lines depict data analysis and trends. Useful for themes involving finance, ocean economy, or digital analytics, showcasing fluctuation and interpretation in uncertain markets.
Powered by 


0
downloads
downloads
Tags:
More
Credit Photo
If you would like to credit the Photo, here are some ways you can do so
Text Link
photo Link
<span class="text-link">
<span>
<a target="_blank" href=https://pikwizard.com/photo/maritime-financial-data-visualization-concept-with-line-graphs-and-sea/3c0e677566a566a2688c179dfde23153/>PikWizard</a>
</span>
</span>
<span class="image-link">
<span
style="margin: 0 0 20px 0; display: inline-block; vertical-align: middle; width: 100%;"
>
<a
target="_blank"
href="https://pikwizard.com/photo/maritime-financial-data-visualization-concept-with-line-graphs-and-sea/3c0e677566a566a2688c179dfde23153/"
style="text-decoration: none; font-size: 10px; margin: 0;"
>
<img src="https://pikwizard.com/pw/medium/3c0e677566a566a2688c179dfde23153.jpg" style="margin: 0; width: 100%;" alt="" />
<p style="font-size: 12px; margin: 0;">PikWizard</p>
</a>
</span>
</span>
Free (free of charge)
Free for personal and commercial use.
Author: Awesome Content
Similar Free Stock Images

Premium


Premium


Premium


Premium


Premium


Premium


Premium


Premium


Premium


Premium


Premium


Premium


Premium


Premium


Premium


Premium


Premium


Premium


Premium


Premium


Premium


Premium


Premium


Premium