
- Home >
- Stock Photos >
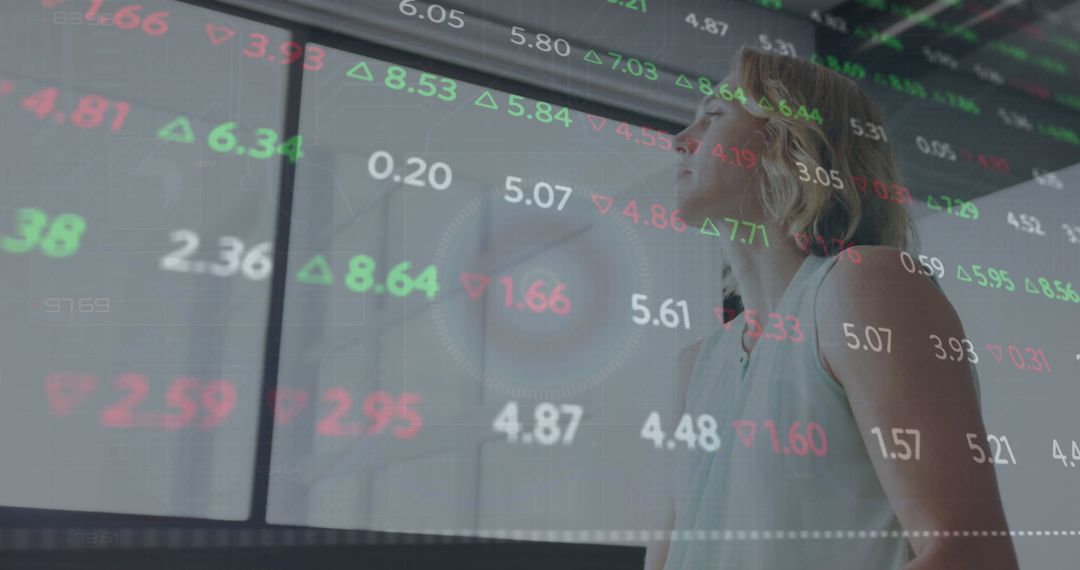
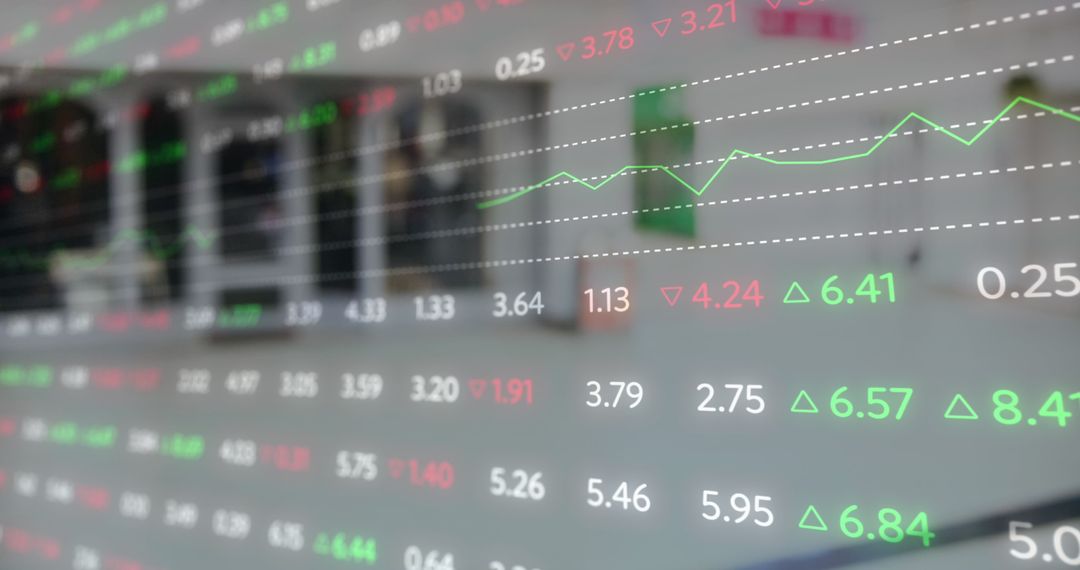
- Market Analyst Reading Real-Time Financial Data on Transparent Touchscreen with Color Arrows
Market Analyst Reading Real-Time Financial Data on Transparent Touchscreen with Color Arrows Image

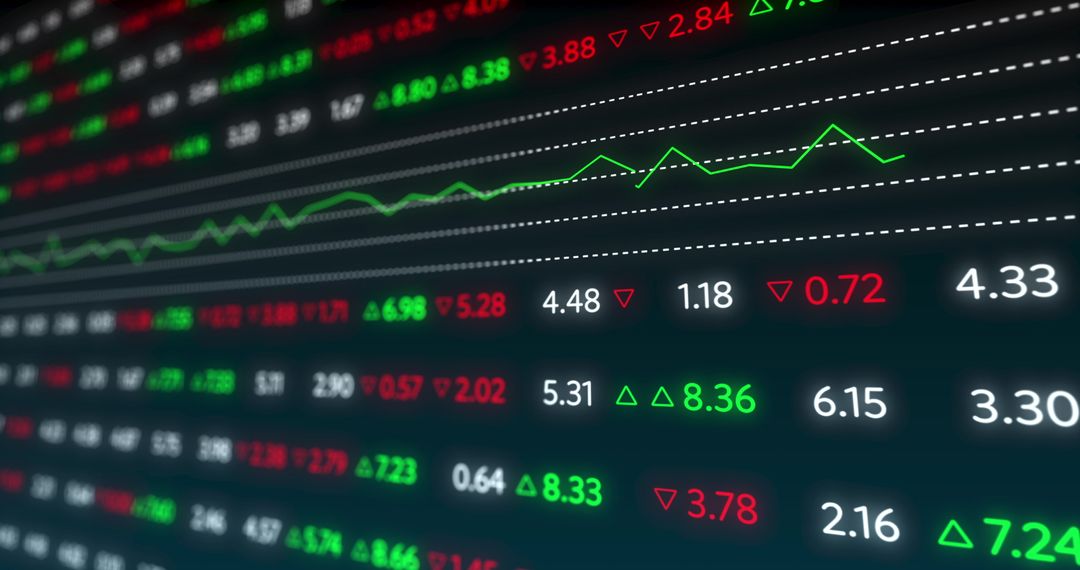
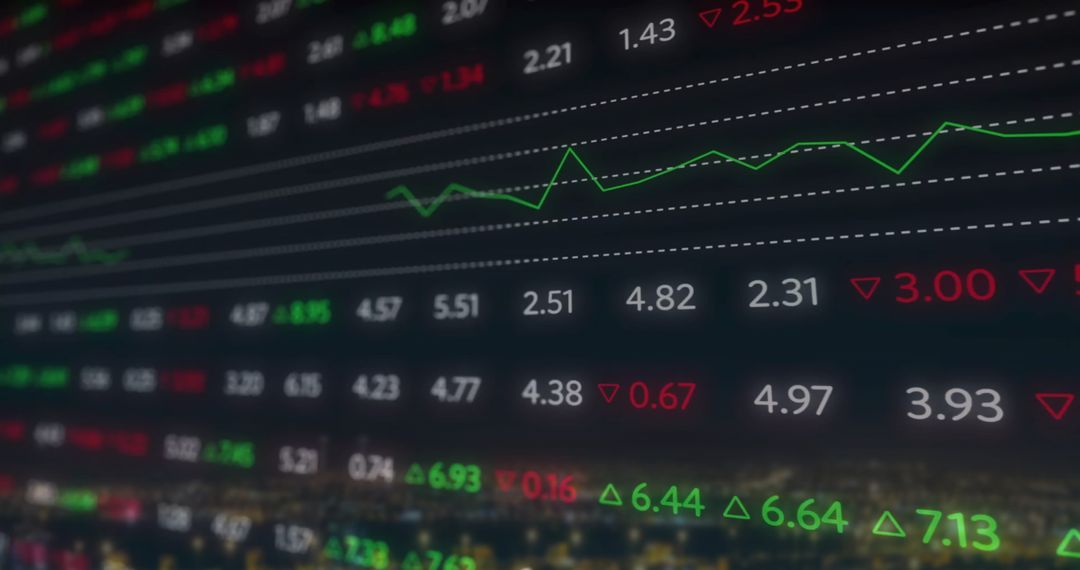
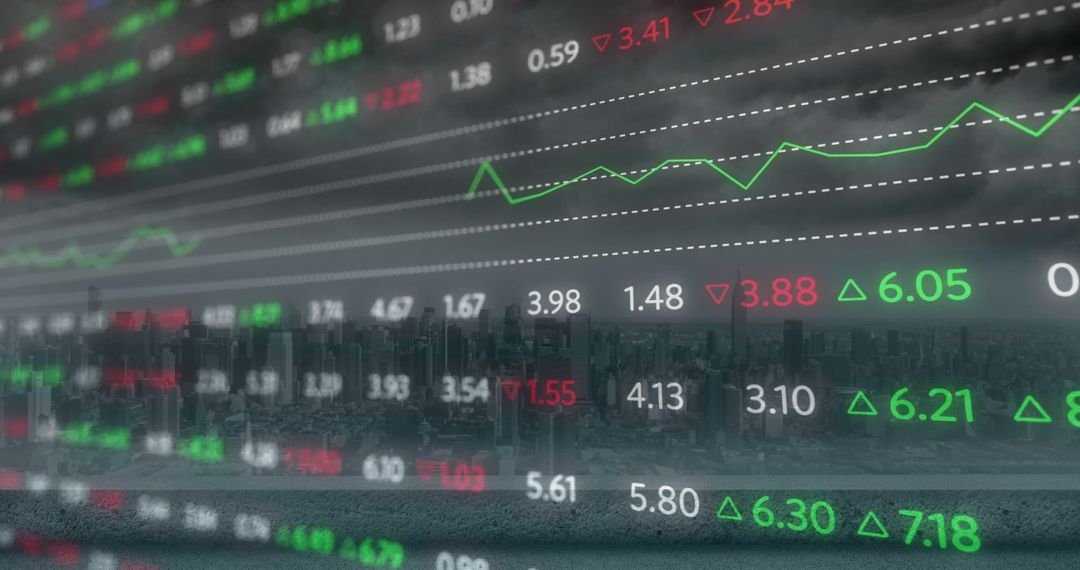
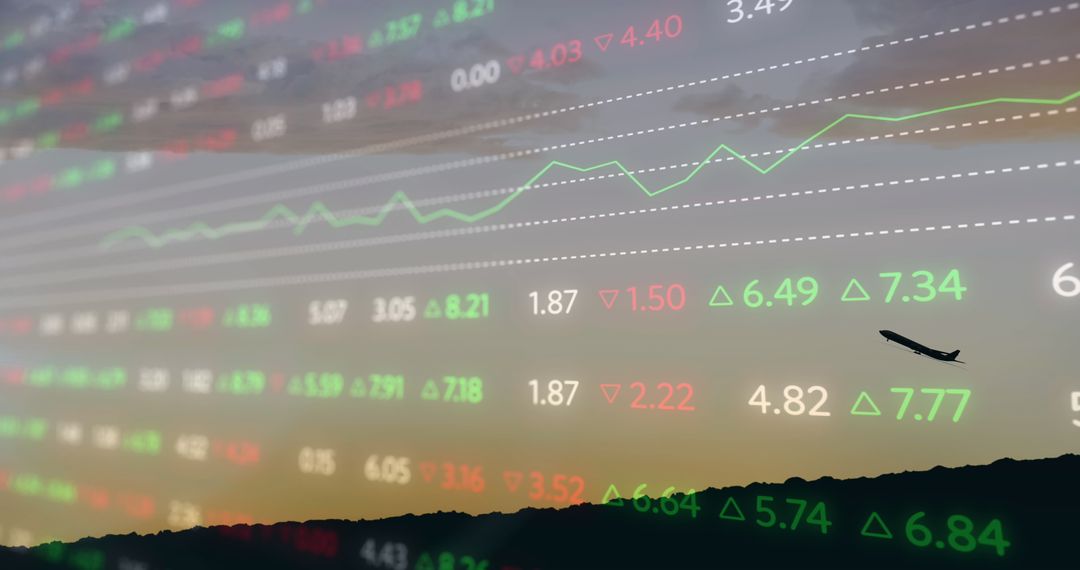
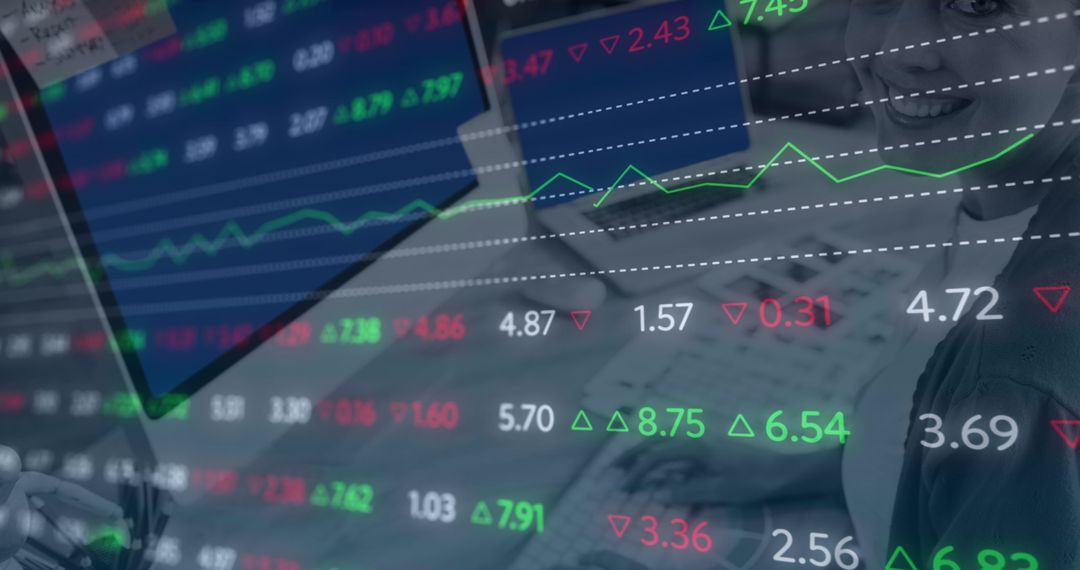
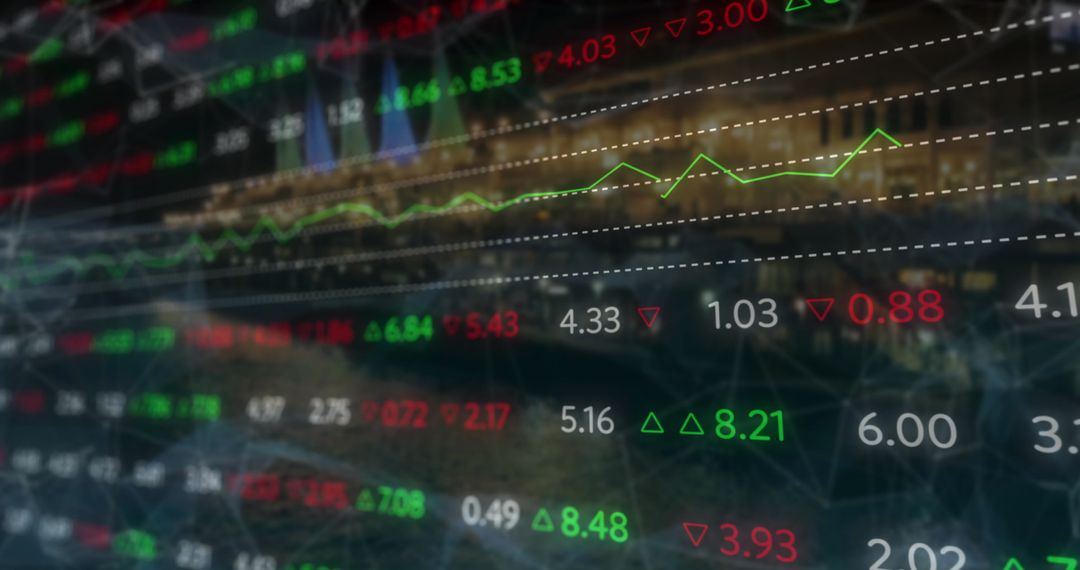
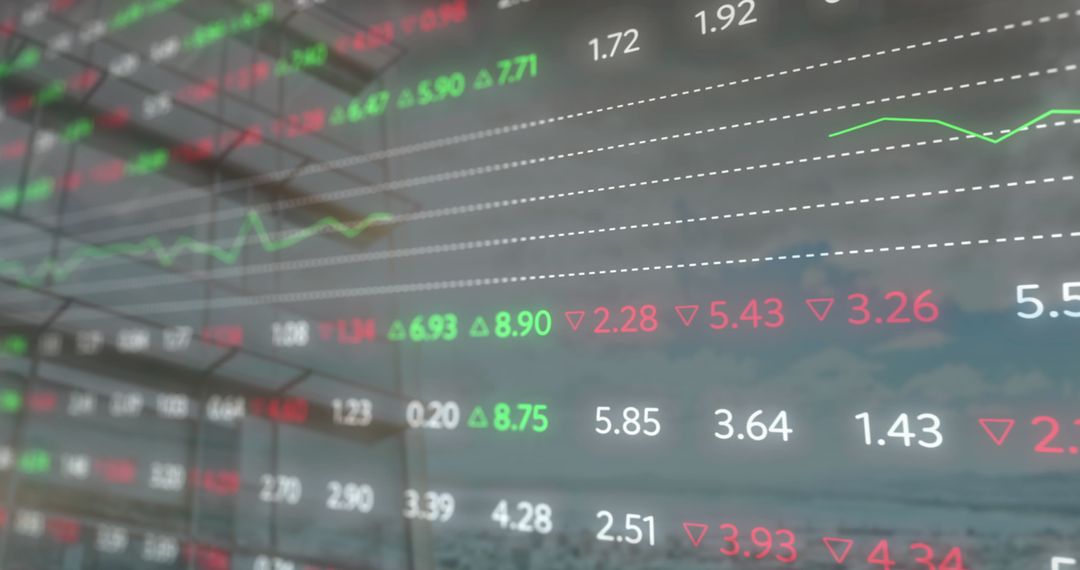
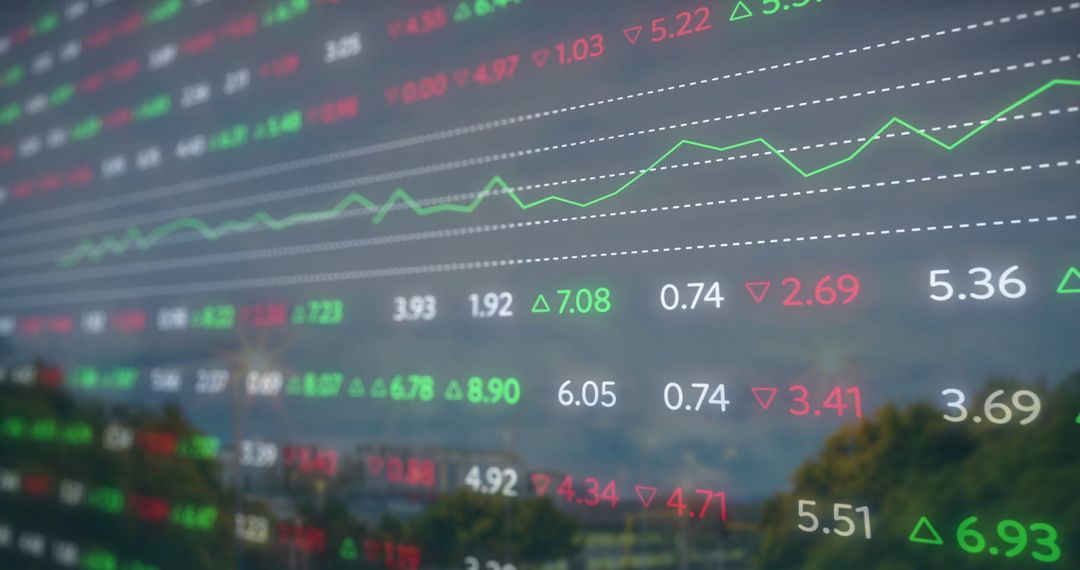
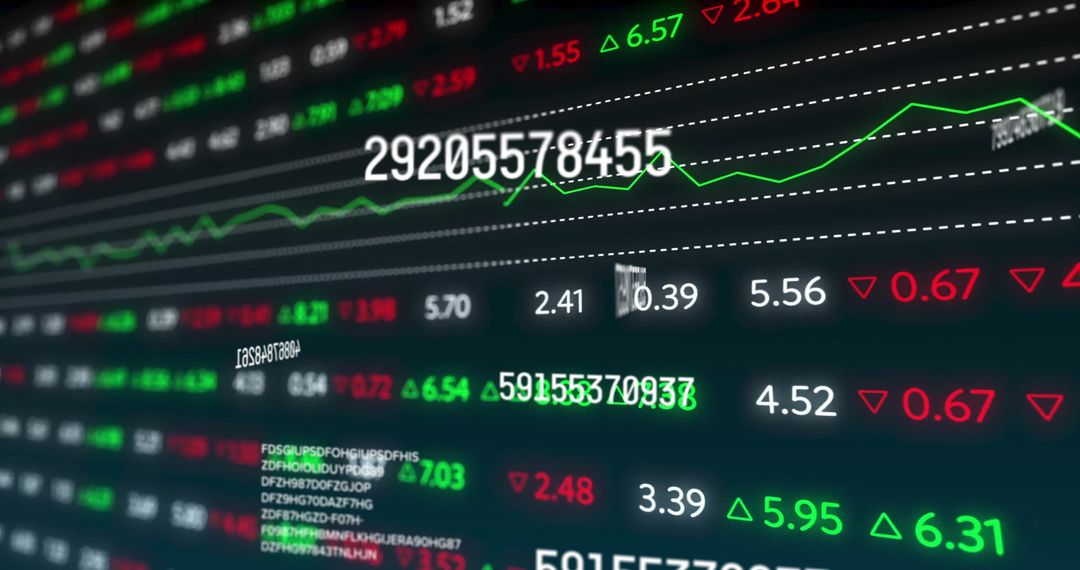
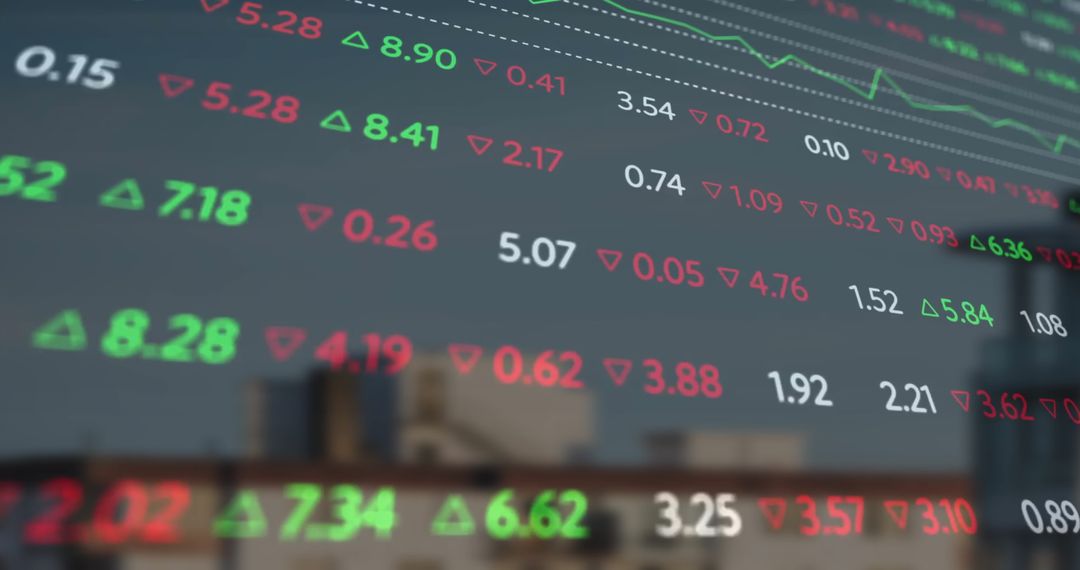
Showing silhouette of man analyzing overlay of market numbers and charts on transparent touchscreen. Featuring green up arrows and red down arrows, jagged line graph, numeric tickers conveying market volatility and momentum. Conveying themes of finance, trading, fintech innovation, data-driven decision making. Suiting corporate websites, fintech app landing pages, investment reports, financial blog posts, market analysis presentations, advertising campaigns for trading platforms. Providing negative space on right side for headline or overlay text. Working well with dark and neon color grading; suggesting bold headline with white or light text for contrast. Suggesting crops: wide crop for banner use, tight crop on hand gesture for hero sections. Delivering modern, high-tech mood for editorial and commercial projects.
Powered by 


0
downloads
downloads
Tags:
More
Credit Photo
If you would like to credit the Photo, here are some ways you can do so
Text Link
photo Link
<span class="text-link">
<span>
<a target="_blank" href=https://pikwizard.com/photo/market-analyst-reading-real-time-financial-data-on-transparent-touchscreen-with-color-arrows/38884db621db6e9d036478079d226477/>PikWizard</a>
</span>
</span>
<span class="image-link">
<span
style="margin: 0 0 20px 0; display: inline-block; vertical-align: middle; width: 100%;"
>
<a
target="_blank"
href="https://pikwizard.com/photo/market-analyst-reading-real-time-financial-data-on-transparent-touchscreen-with-color-arrows/38884db621db6e9d036478079d226477/"
style="text-decoration: none; font-size: 10px; margin: 0;"
>
<img src="https://pikwizard.com/pw/medium/38884db621db6e9d036478079d226477.jpg" style="margin: 0; width: 100%;" alt="" />
<p style="font-size: 12px; margin: 0;">PikWizard</p>
</a>
</span>
</span>
Free (free of charge)
Free for personal and commercial use.
Author: Awesome Content
Similar Free Stock Images
Premium


Premium


Premium


Premium


Premium


Premium


Premium


Premium


Premium


Premium


Premium


Premium


Premium


Premium


Premium


Premium


Premium


Premium


Premium


Premium


Premium


Premium


Premium


Premium

