- Home >
- Stock Photos >
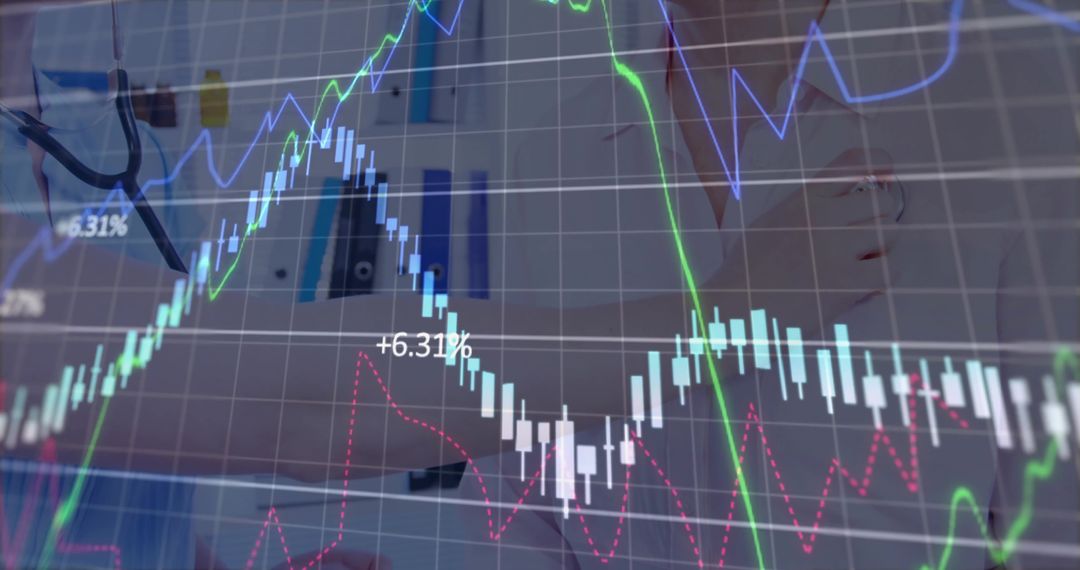
- Market dashboard displaying candlestick chart, volume profile and moving averages
Market dashboard displaying candlestick chart, volume profile and moving averages Image

High-resolution visualization showing candlestick chart overlaid with moving averages, volume histogram and percentage labels. Dark grid background enhancing contrast of green and red traces and colored bars. Graphic serving financial websites, trading blogs, investor presentations, market research reports, fintech product UI and social media posts. Visual working well for illustrating trading strategies, technical analysis concepts, trend identification, risk management and algorithmic backtesting. Layered composition allowing overlay of text, charts or branding. Composition fitting hero banners, slide decks, course materials and marketing assets targeting traders, brokers and investors.
Powered by  - Get 15% off with code: PIKWIZARD15


0
downloads
downloads
Tags:
More
Credit Photo
If you would like to credit the Photo, here are some ways you can do so
Text Link
photo Link
<span class="text-link">
<span>
<a target="_blank" href=https://pikwizard.com/photo/market-dashboard-displaying-candlestick-chart-volume-profile-and-moving-averages/286834b32b60c015b823314f3177da5b/>PikWizard</a>
</span>
</span>
<span class="image-link">
<span
style="margin: 0 0 20px 0; display: inline-block; vertical-align: middle; width: 100%;"
>
<a
target="_blank"
href="https://pikwizard.com/photo/market-dashboard-displaying-candlestick-chart-volume-profile-and-moving-averages/286834b32b60c015b823314f3177da5b/"
style="text-decoration: none; font-size: 10px; margin: 0;"
>
<img src="https://pikwizard.com/pw/medium/286834b32b60c015b823314f3177da5b.jpg" style="margin: 0; width: 100%;" alt="" />
<p style="font-size: 12px; margin: 0;">PikWizard</p>
</a>
</span>
</span>
Free (free of charge)
Free for personal and commercial use.
Author: Awesome Content
Similar Free Stock Images