
- Home >
- Stock Photos >
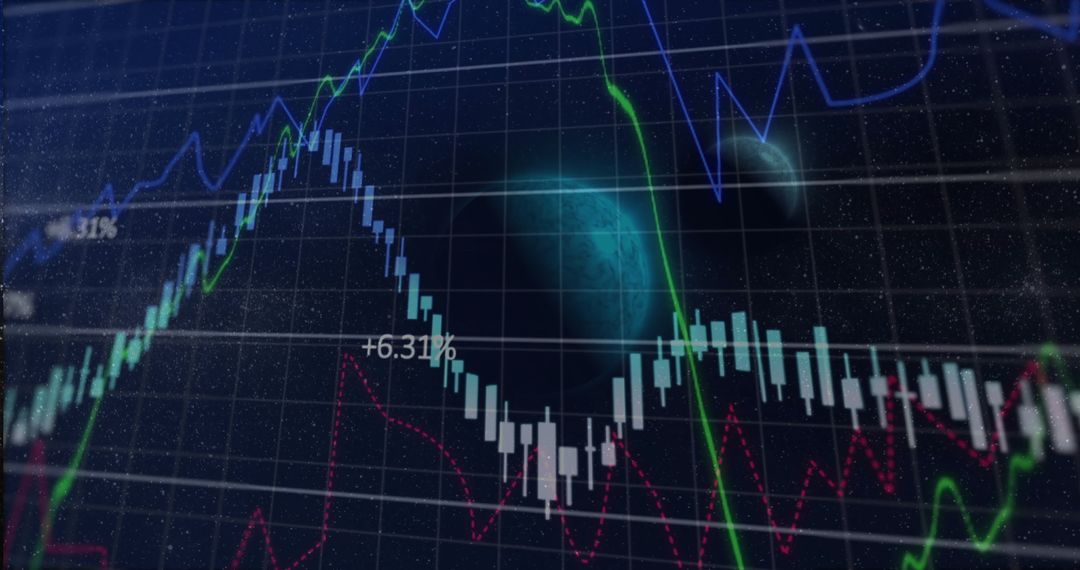
- Market Dashboard Showing Downward Arrow Over Candlestick Charts and Percentage Labels
Market Dashboard Showing Downward Arrow Over Candlestick Charts and Percentage Labels Image

Featuring candlestick charts, bar histograms, multicolor trend lines, and percent labels over grid background. Red diagonal arrow cutting across charts, emphasizing market decline and bearish momentum. Suiting financial reports, market commentary, investment presentations, trading education, stock analysis blogs, trading platform mockups, social media banners, and newsletter headers. Using cropping to create space for headline or KPI overlays in top-left or right-side panels. High contrast and layered elements supporting modern fintech and business design. Consider adding semi-transparent overlay for text readability or combining with headline copy and brand logo.
Powered by  - Get 15% off with code: PIKWIZARD15


0
downloads
downloads
Tags:
More
Credit Photo
If you would like to credit the Photo, here are some ways you can do so
Text Link
photo Link
<span class="text-link">
<span>
<a target="_blank" href=https://pikwizard.com/photo/market-dashboard-showing-downward-arrow-over-candlestick-charts-and-percentage-labels/3f646406a9bff6339bb70c7717928e83/>PikWizard</a>
</span>
</span>
<span class="image-link">
<span
style="margin: 0 0 20px 0; display: inline-block; vertical-align: middle; width: 100%;"
>
<a
target="_blank"
href="https://pikwizard.com/photo/market-dashboard-showing-downward-arrow-over-candlestick-charts-and-percentage-labels/3f646406a9bff6339bb70c7717928e83/"
style="text-decoration: none; font-size: 10px; margin: 0;"
>
<img src="https://pikwizard.com/pw/medium/3f646406a9bff6339bb70c7717928e83.jpg" style="margin: 0; width: 100%;" alt="" />
<p style="font-size: 12px; margin: 0;">PikWizard</p>
</a>
</span>
</span>
Free (free of charge)
Free for personal and commercial use.
Author: Authentic Images
Similar Free Stock Images

Premium


Premium


Premium


Premium


Premium


Premium


Premium


Premium


Premium


Premium


Premium


Premium


Premium


Premium


Premium


Premium


Premium


Premium


Premium


Premium


Premium


Premium


Premium


Premium

