
- Home >
- Stock Photos >
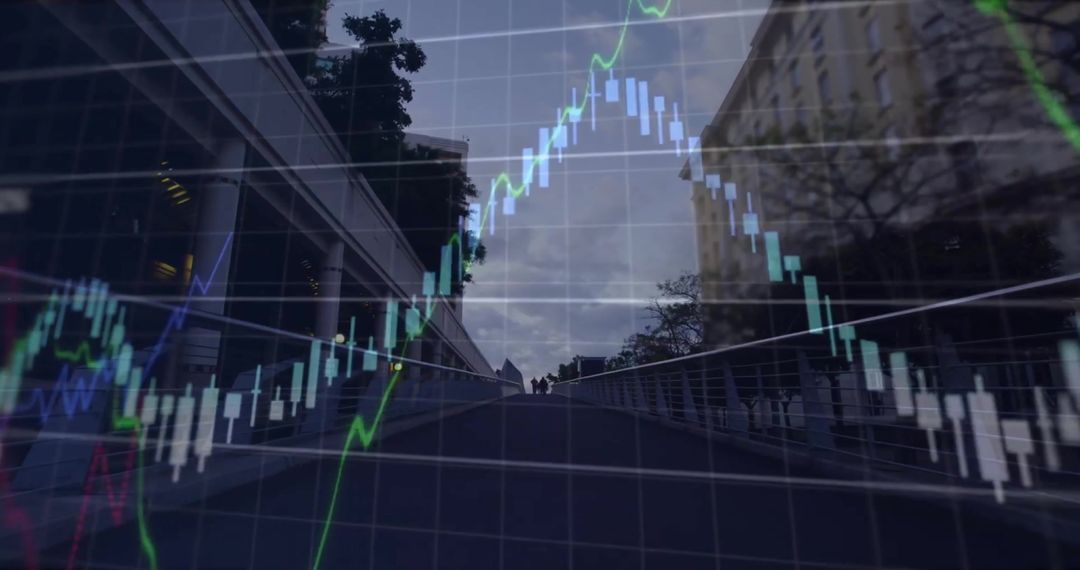
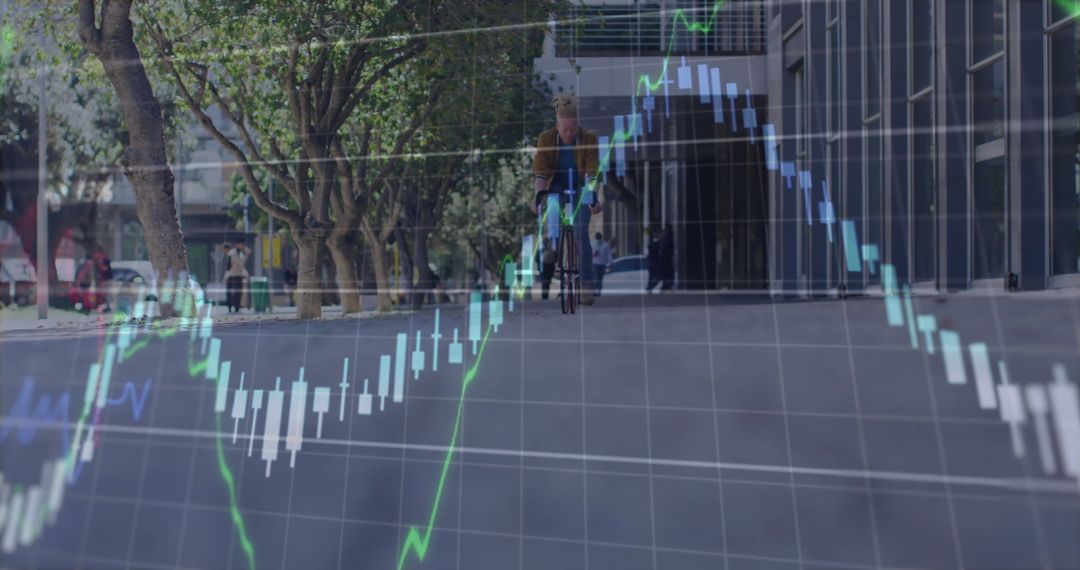
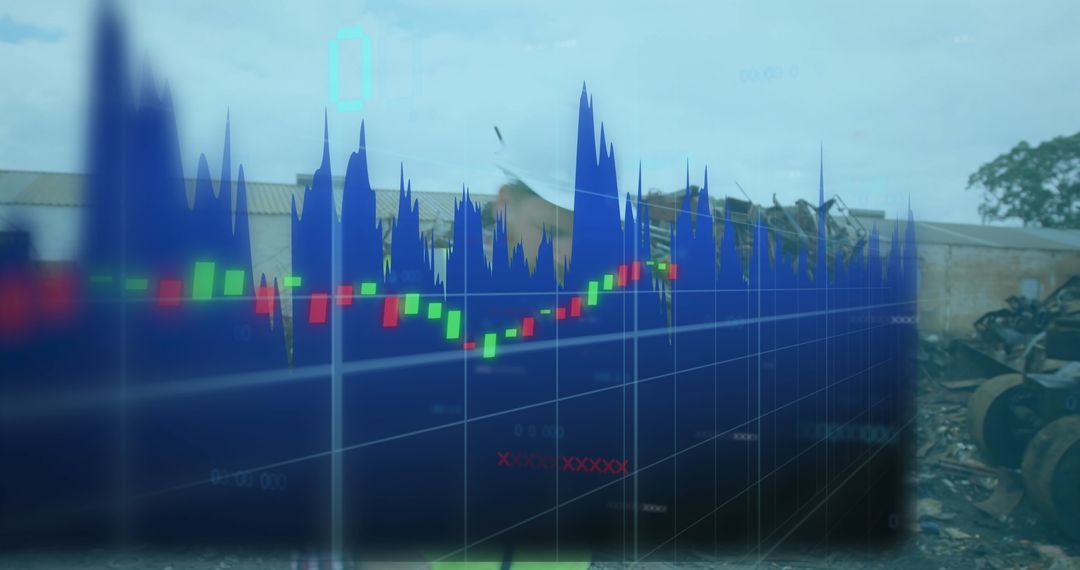
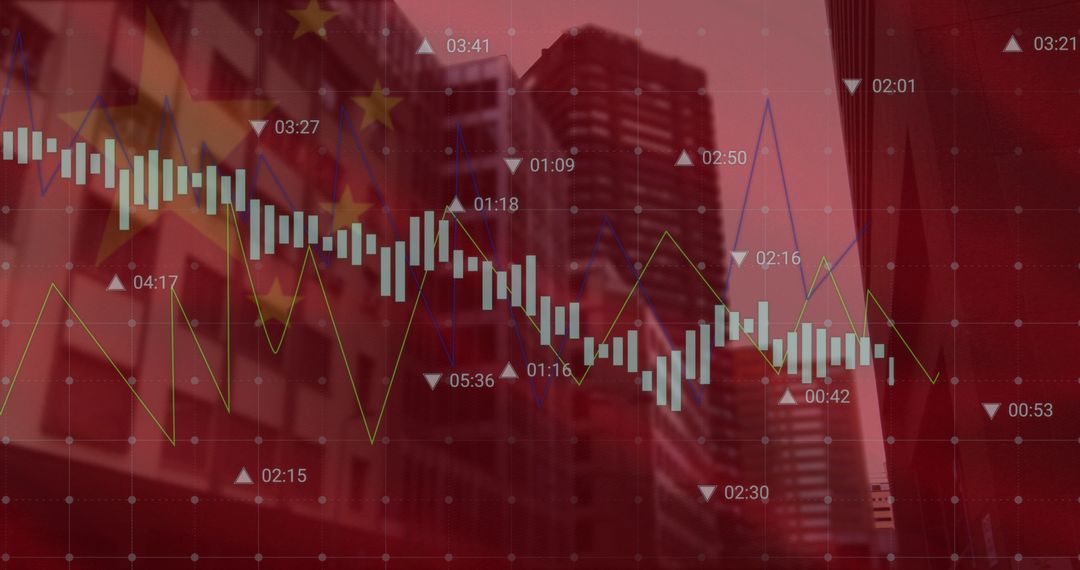
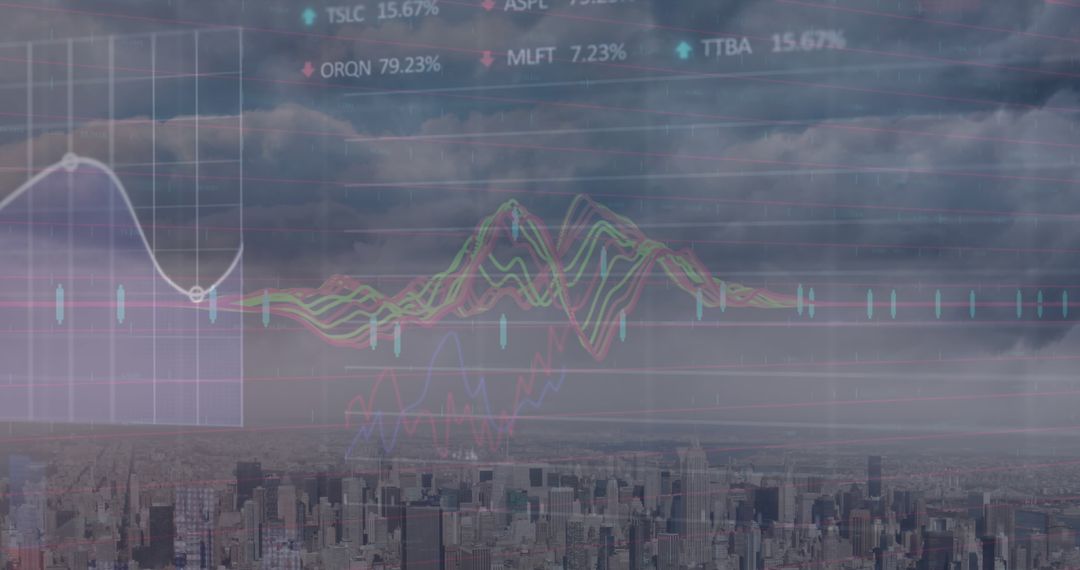
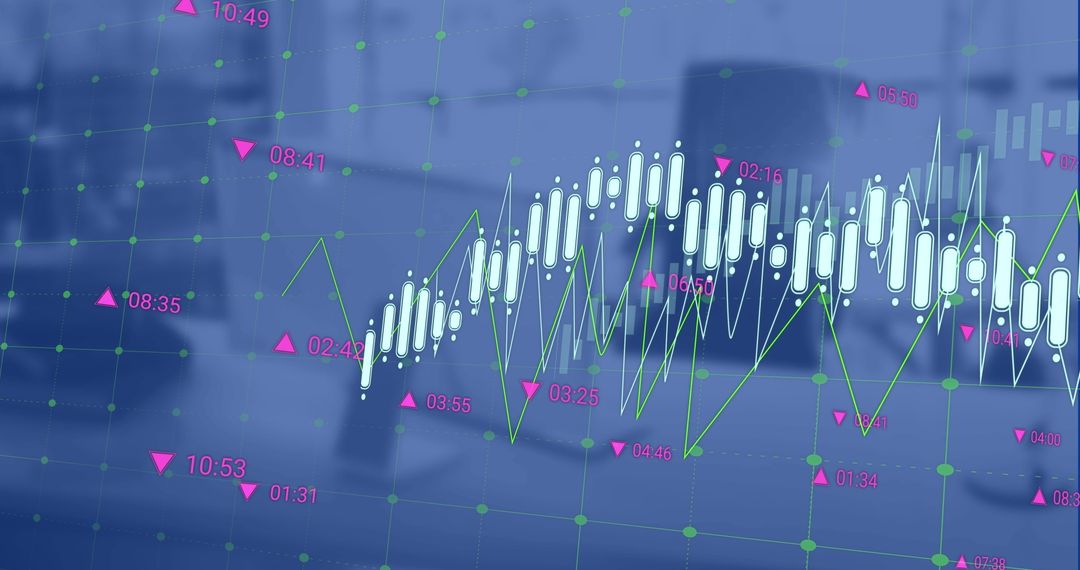
- Market Data Overlay over Urban Crowd with Candlestick Chart, Blue Area Graph
Market Data Overlay over Urban Crowd with Candlestick Chart, Blue Area Graph Image

Depicting large candlestick chart with green and red candles and blue area graph over blurred urban crowd and plaza scene, creating contrast between finance data and public space. Gridlines and numeric markers adding technical trading feel and depth. High-contrast overlay blending financial analytics with human environment, suggesting market impact on city life and investor sentiment. Useful for financial news banners, fintech landing pages, market analysis reports, business presentations, social media posts, editorial pieces on economics, investment research, and urban finance stories. Customization ideas: crop for website hero, add headline and data labels, animate graph elements for video, use as background for webinar slides or report covers. Color palette suggestions: retain blue hues for trust, use accent green and red for gain and loss indicators.
Powered by  - Get 15% off with code: PIKWIZARD15


0
downloads
downloads
Tags:
More
Credit Photo
If you would like to credit the Photo, here are some ways you can do so
Text Link
photo Link
<span class="text-link">
<span>
<a target="_blank" href=https://pikwizard.com/photo/market-data-overlay-over-urban-crowd-with-candlestick-chart-blue-area-graph/3482f8b29784d04c1e5ab52d8739b6ac/>PikWizard</a>
</span>
</span>
<span class="image-link">
<span
style="margin: 0 0 20px 0; display: inline-block; vertical-align: middle; width: 100%;"
>
<a
target="_blank"
href="https://pikwizard.com/photo/market-data-overlay-over-urban-crowd-with-candlestick-chart-blue-area-graph/3482f8b29784d04c1e5ab52d8739b6ac/"
style="text-decoration: none; font-size: 10px; margin: 0;"
>
<img src="https://pikwizard.com/pw/medium/3482f8b29784d04c1e5ab52d8739b6ac.jpg" style="margin: 0; width: 100%;" alt="" />
<p style="font-size: 12px; margin: 0;">PikWizard</p>
</a>
</span>
</span>
Free (free of charge)
Free for personal and commercial use.
Author: Authentic Images
Similar Free Stock Images

Premium


Premium


Premium


Premium


Premium


Premium


Premium


Premium


Premium


Premium


Premium


Premium


Premium


Premium


Premium


Premium


Premium


Premium


Premium


Premium


Premium


Premium


Premium


Premium

