- Home >
- Stock Photos >
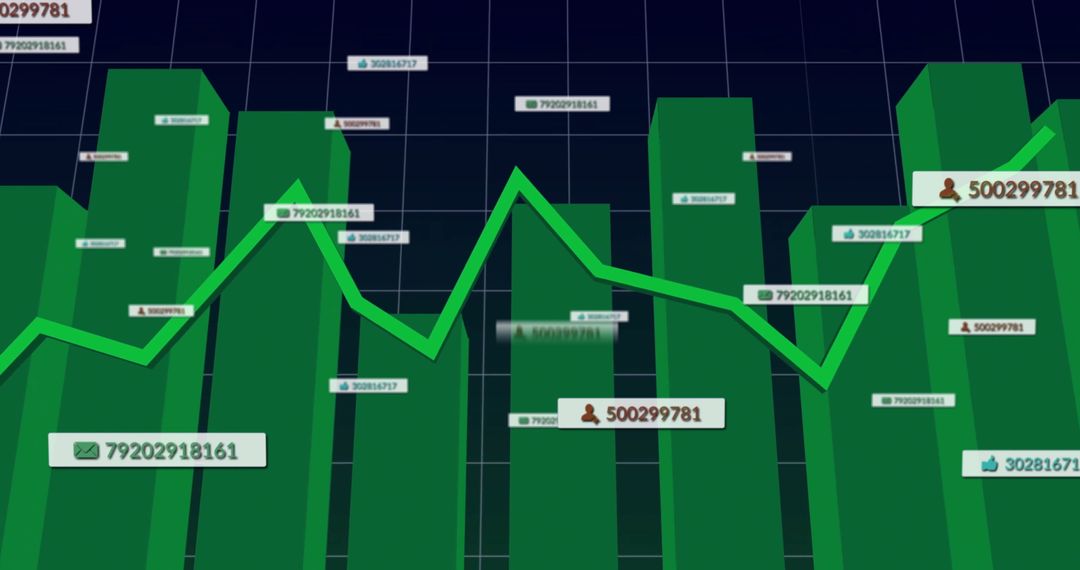
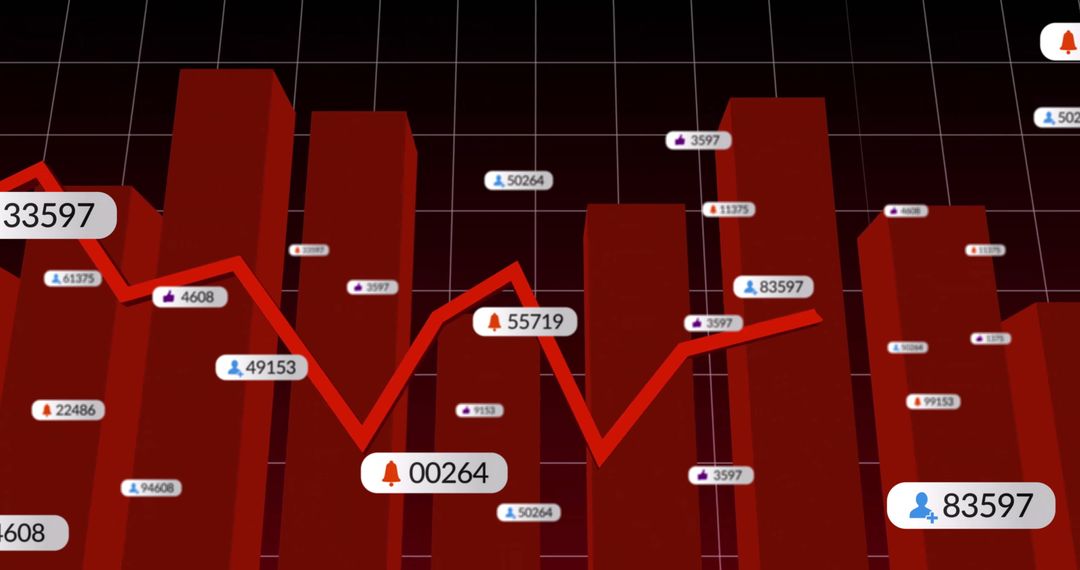
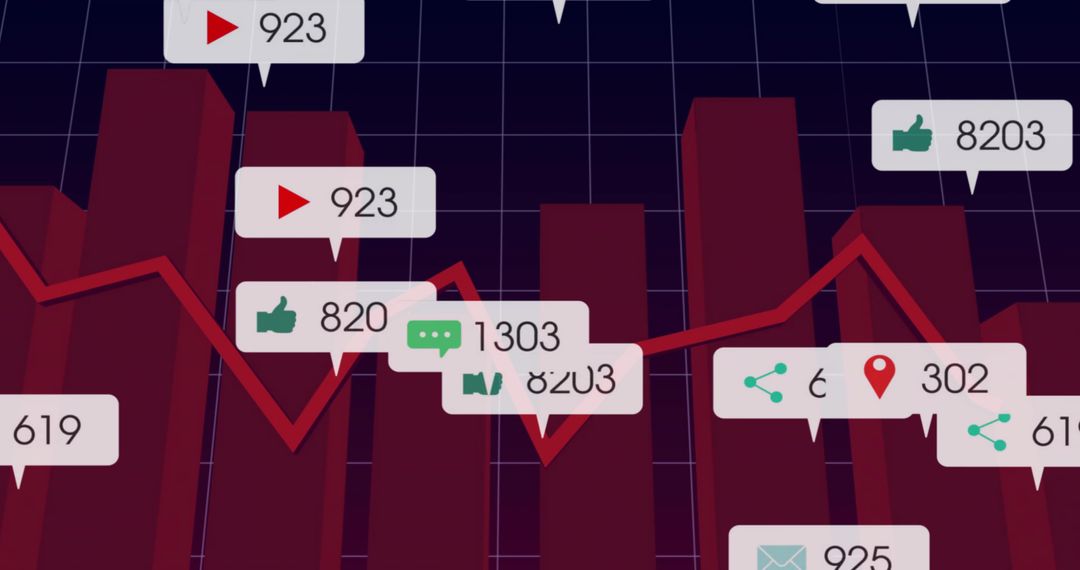
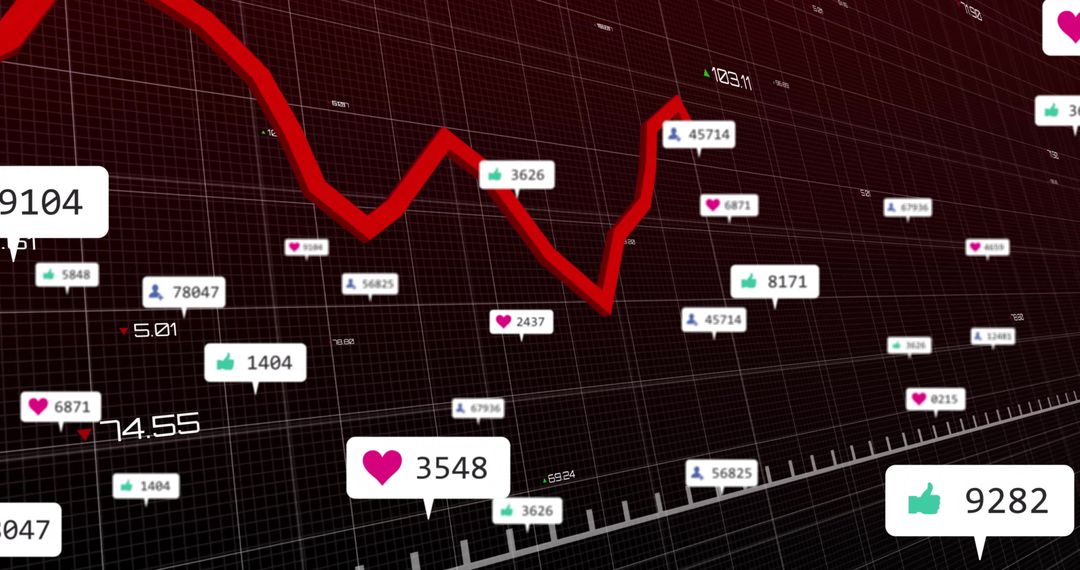
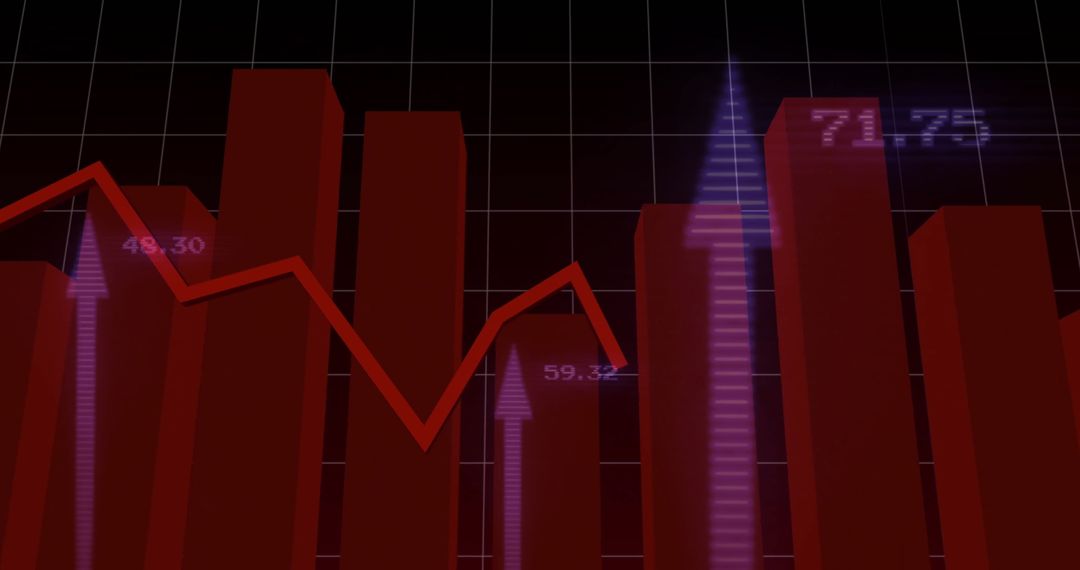
- Maroon 3D Bars Displaying Red Trend Line with Floating Social Media Metric Callouts
Maroon 3D Bars Displaying Red Trend Line with Floating Social Media Metric Callouts Image
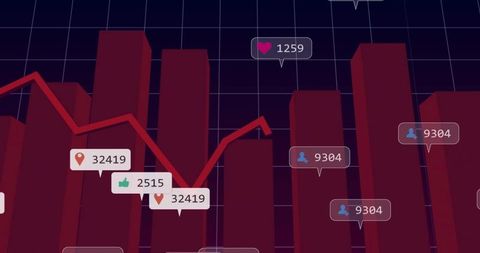
Graphic depicting maroon 3D bars rising and falling along a red trend line over dark navy grid, with floating callout labels showing likes, follower counts, location pins and thumbs-up icons. High-contrast color palette helping emphasize metrics and trends, while 3D columns adding depth for modern visual appeal. Ideal for business presentations, social media analytics reports, marketing dashboards, investor decks and data-driven blog headers. Use as hero banner, slide background, report cover or infographic element to illustrate engagement trends, growth tracking, performance benchmarking and campaign results. Customize by overlaying company logo, adding headline text or changing color scheme to match brand palette.
Powered by  - Get 15% off with code: PIKWIZARD15


0
downloads
downloads
Tags:
More
Credit Photo
If you would like to credit the Photo, here are some ways you can do so
Text Link
photo Link
<span class="text-link">
<span>
<a target="_blank" href=https://pikwizard.com/photo/maroon-3d-bars-displaying-red-trend-line-with-floating-social-media-metric-callouts/3c1e977f9245156cfc1e88283067cb96/>PikWizard</a>
</span>
</span>
<span class="image-link">
<span
style="margin: 0 0 20px 0; display: inline-block; vertical-align: middle; width: 100%;"
>
<a
target="_blank"
href="https://pikwizard.com/photo/maroon-3d-bars-displaying-red-trend-line-with-floating-social-media-metric-callouts/3c1e977f9245156cfc1e88283067cb96/"
style="text-decoration: none; font-size: 10px; margin: 0;"
>
<img src="https://pikwizard.com/pw/medium/3c1e977f9245156cfc1e88283067cb96.jpg" style="margin: 0; width: 100%;" alt="" />
<p style="font-size: 12px; margin: 0;">PikWizard</p>
</a>
</span>
</span>
Free (free of charge)
Free for personal and commercial use.
Author: People Creations
Similar Free Stock Images

Premium


Premium


Premium


Premium


Premium


Premium


Premium


Premium


Premium


Premium


Premium


Premium


Premium


Premium


Premium


Premium


Premium


Premium


Premium


Premium


Premium


Premium


Premium


Premium