
- Home >
- Stock Photos >
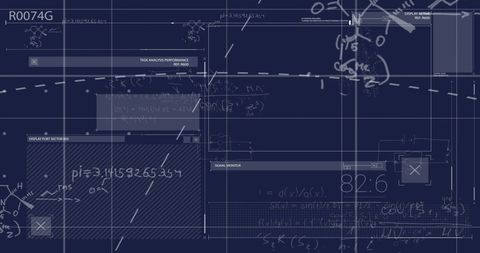
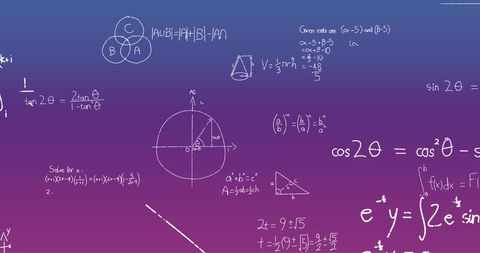
- Mathematical Equations and Data Analysis Overlay Concept
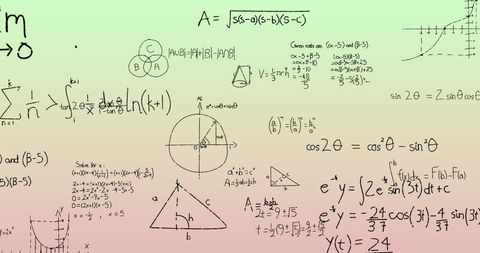
Mathematical Equations and Data Analysis Overlay Concept Image
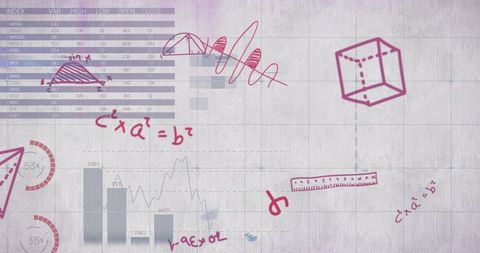
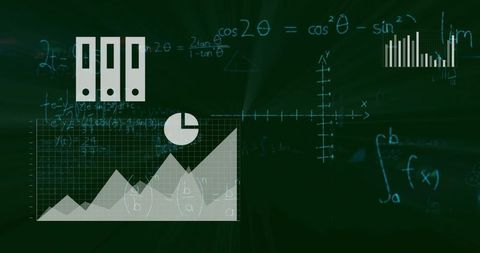
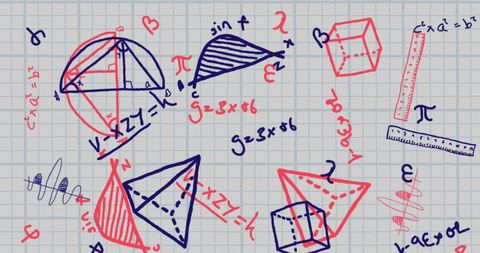
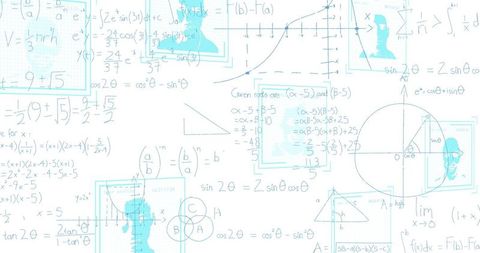
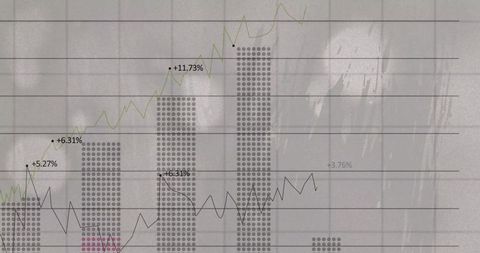
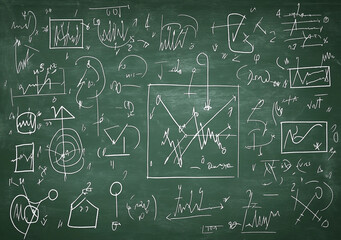
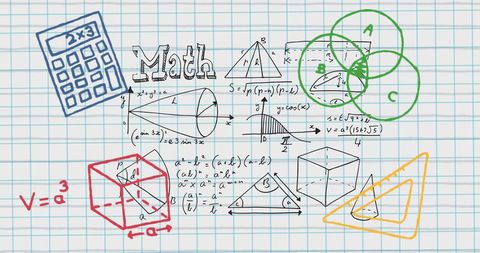
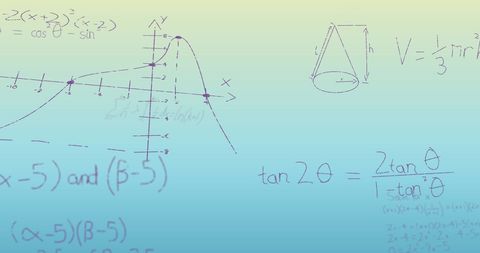
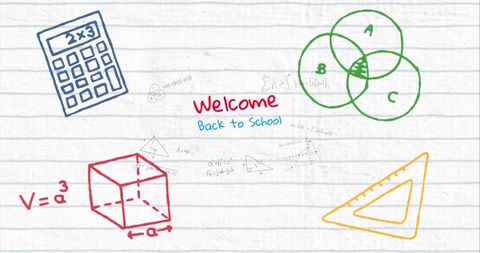
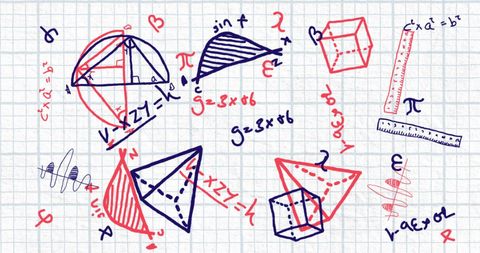
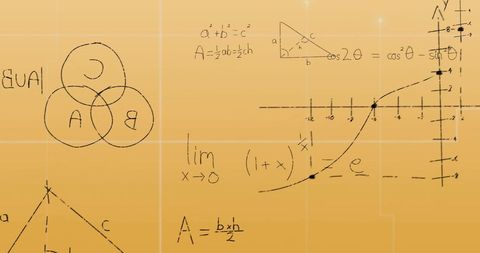
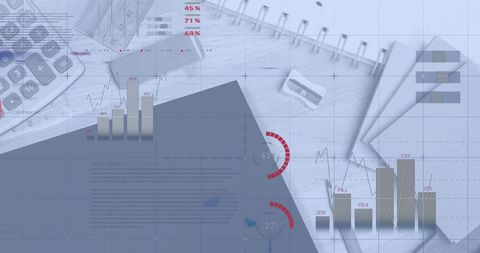
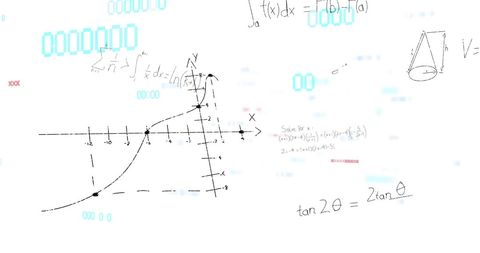
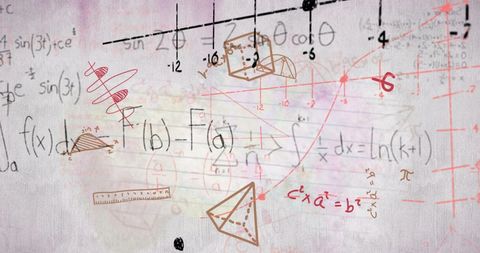
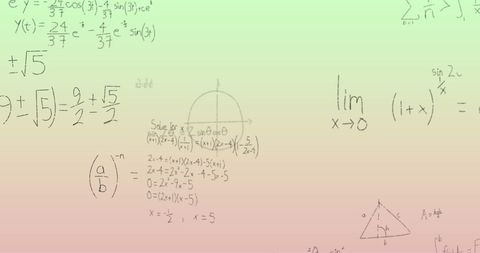
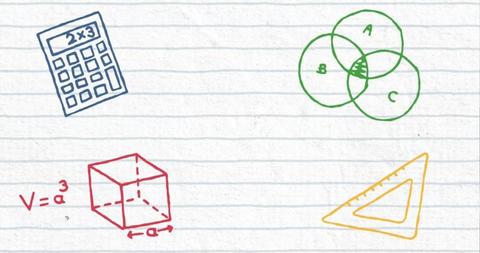
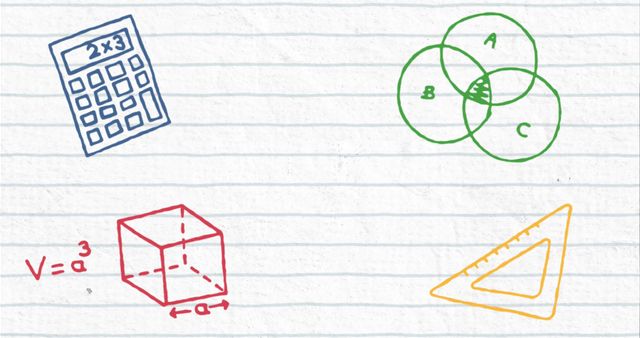
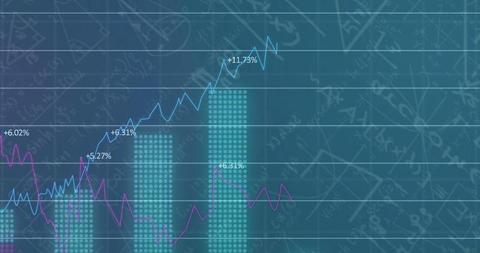
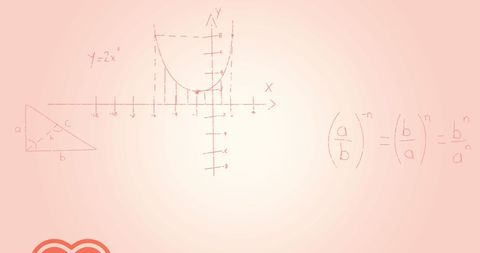
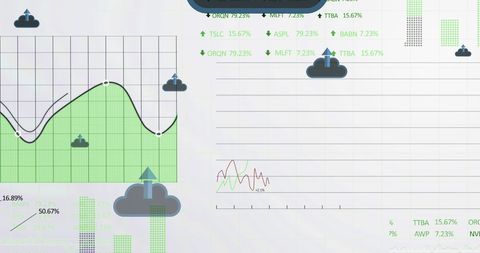
Digital overlay features mathematical equations and data charts combining abstract diagrams. Ideal for educational materials and presentations on scientific analysis or teaching tools focused on mathematics, data interpretation, and statistical reasoning.
Powered by 


downloads
Tags:
More
Credit Photo
If you would like to credit the Photo, here are some ways you can do so
Text Link
photo Link
<span class="text-link">
<span>
<a target="_blank" href=https://pikwizard.com/photo/mathematical-equations-and-data-analysis-overlay-concept/2c8115a97d87480efb182d38cb8a7e8c/>PikWizard</a>
</span>
</span>
<span class="image-link">
<span
style="margin: 0 0 20px 0; display: inline-block; vertical-align: middle; width: 100%;"
>
<a
target="_blank"
href="https://pikwizard.com/photo/mathematical-equations-and-data-analysis-overlay-concept/2c8115a97d87480efb182d38cb8a7e8c/"
style="text-decoration: none; font-size: 10px; margin: 0;"
>
<img src="https://pikwizard.com/pw/medium/2c8115a97d87480efb182d38cb8a7e8c.jpg" style="margin: 0; width: 100%;" alt="" />
<p style="font-size: 12px; margin: 0;">PikWizard</p>
</a>
</span>
</span>
Free (free of charge)
Free for personal and commercial use.
Author: Authentic Images
Similar Free Stock Images

Premium

Premium


Premium


Premium


Premium


Premium


Premium

Premium


Premium


Premium

Premium
Premium


Premium


Premium


Premium


Premium


Premium


Premium


Premium


Premium


Premium


Premium


Premium


Premium


Premium

Explore More Free Stock Images