- Home >
- Stock Photos >
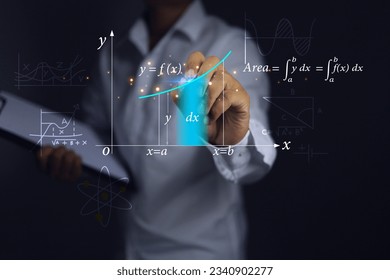
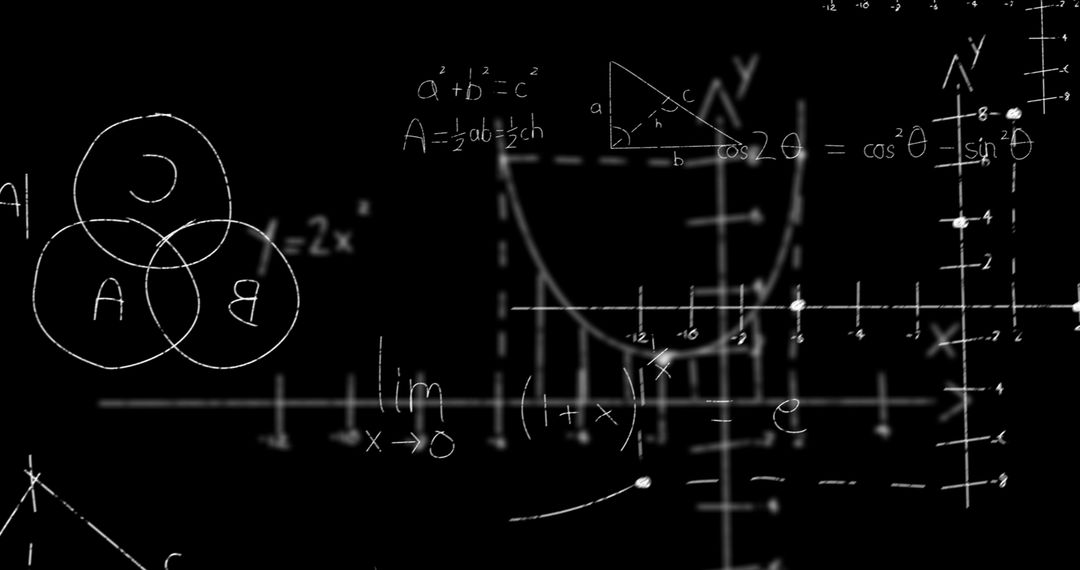
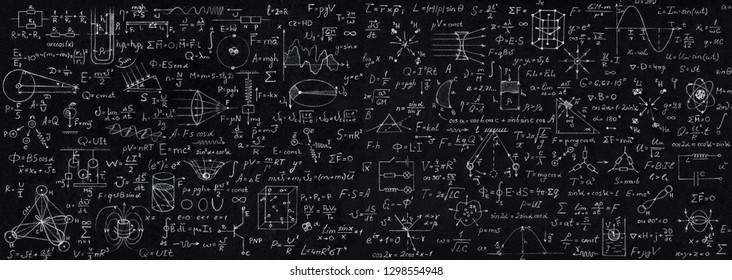
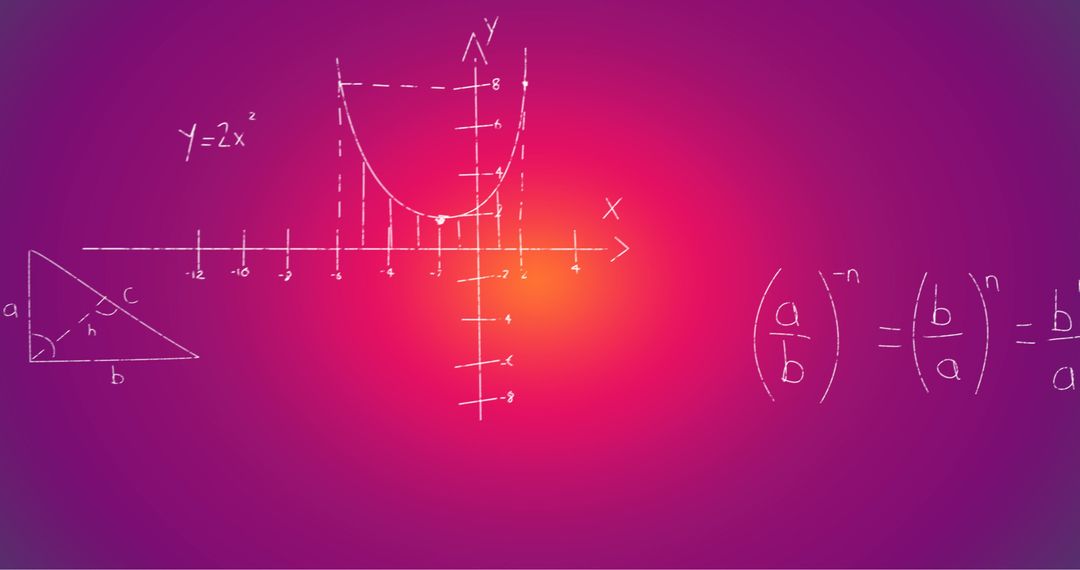
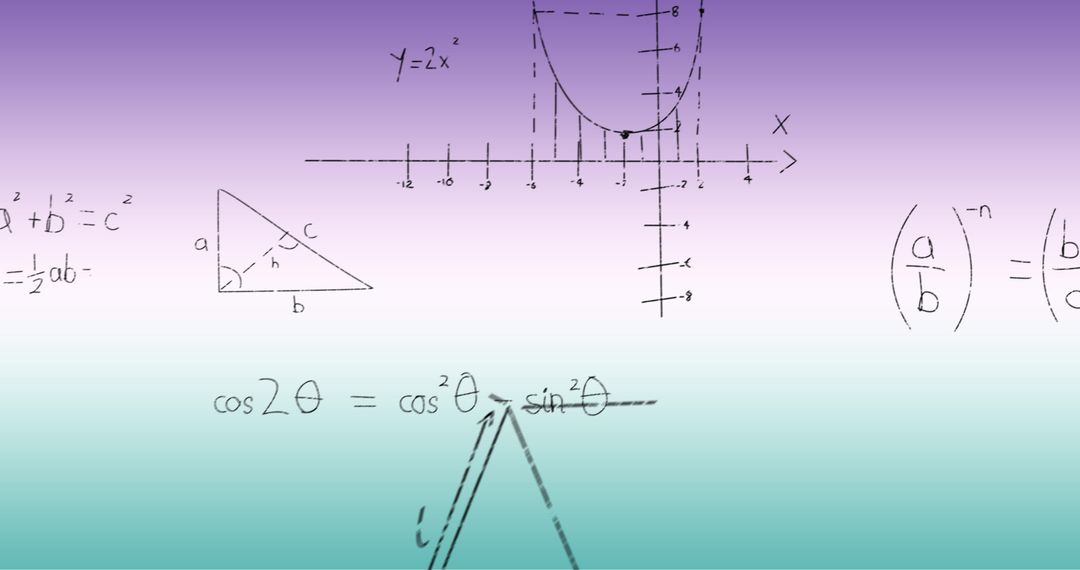
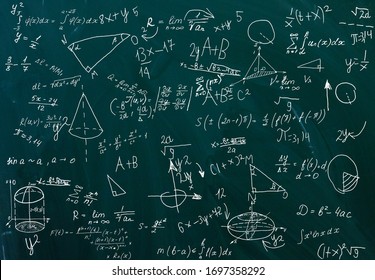
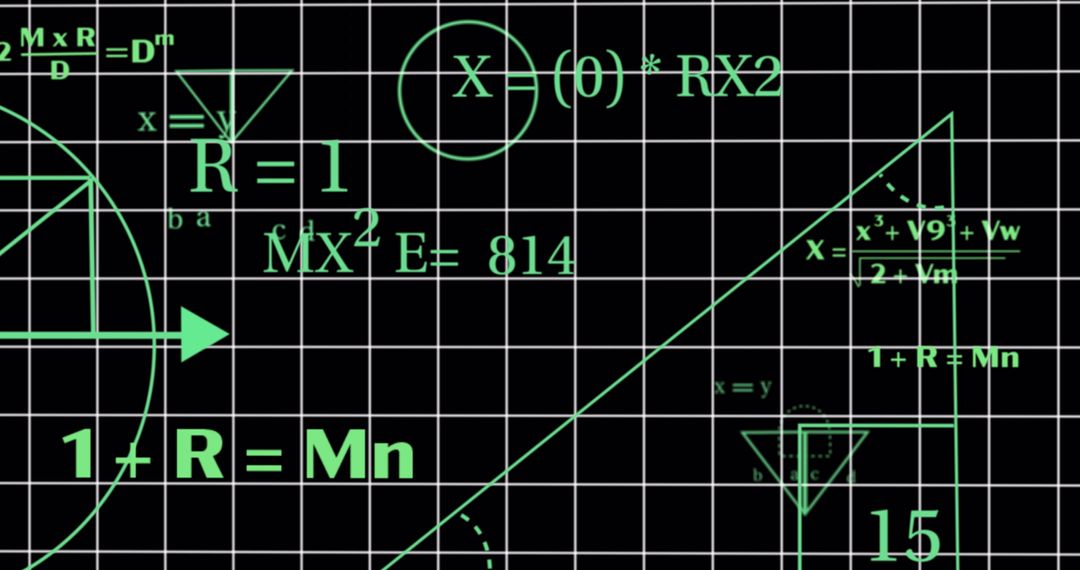
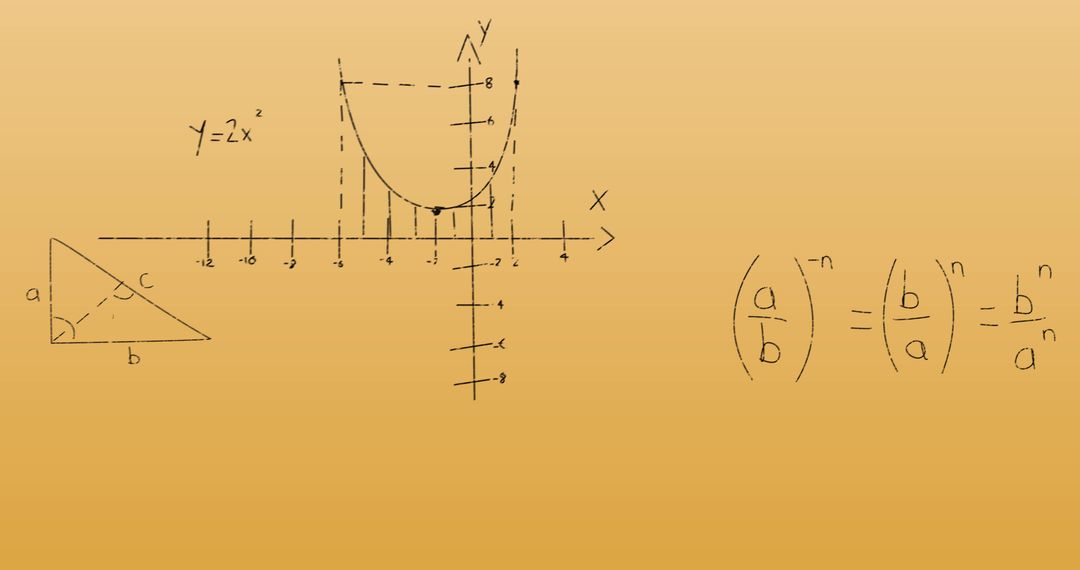
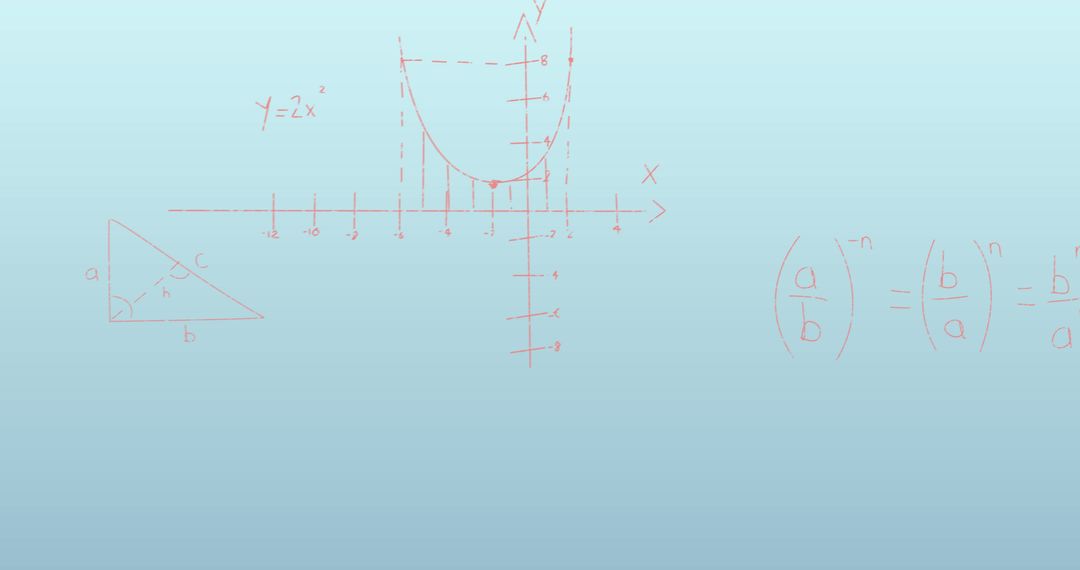
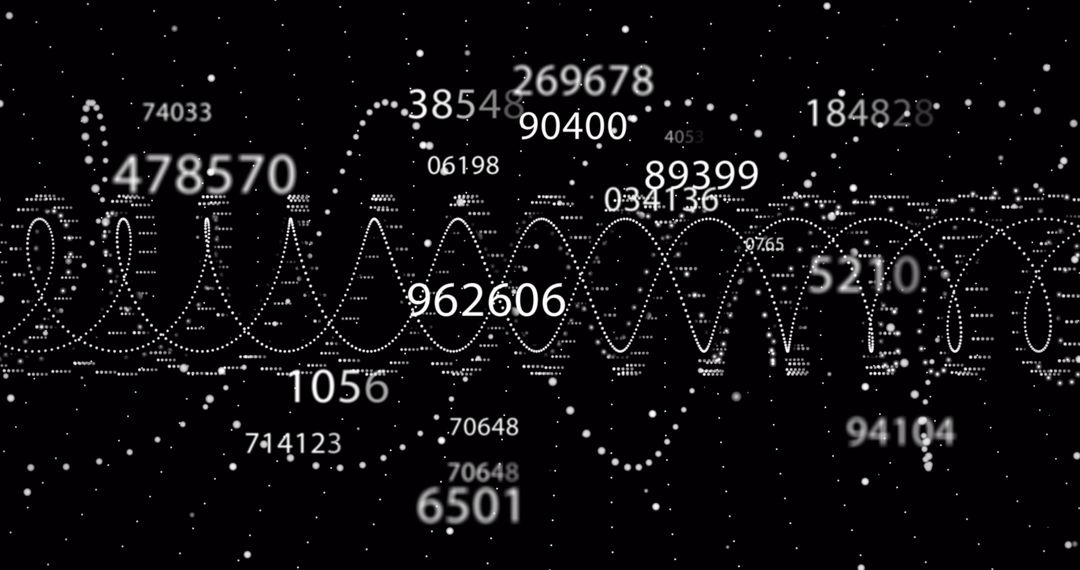
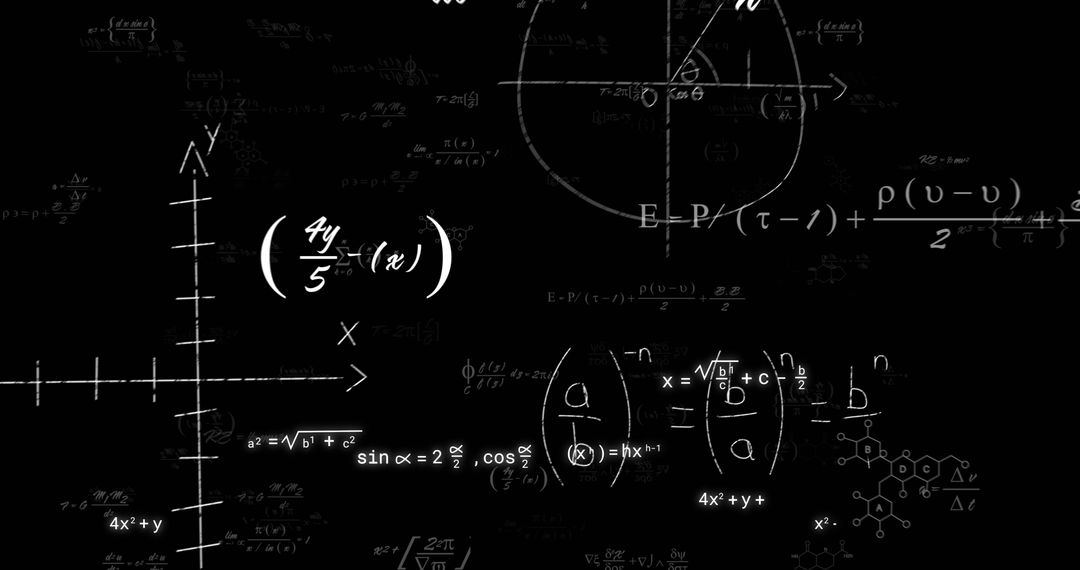
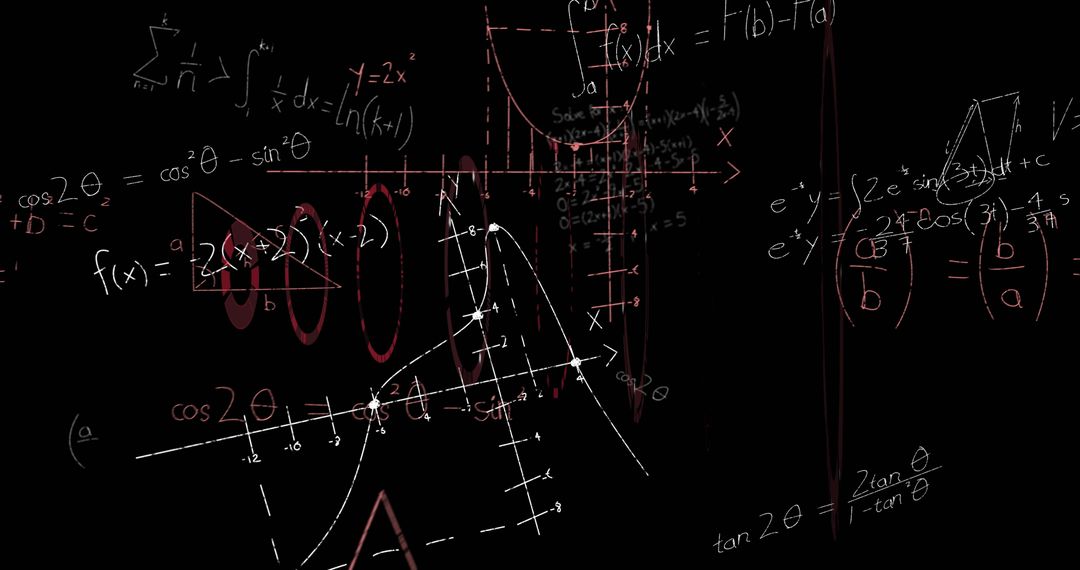
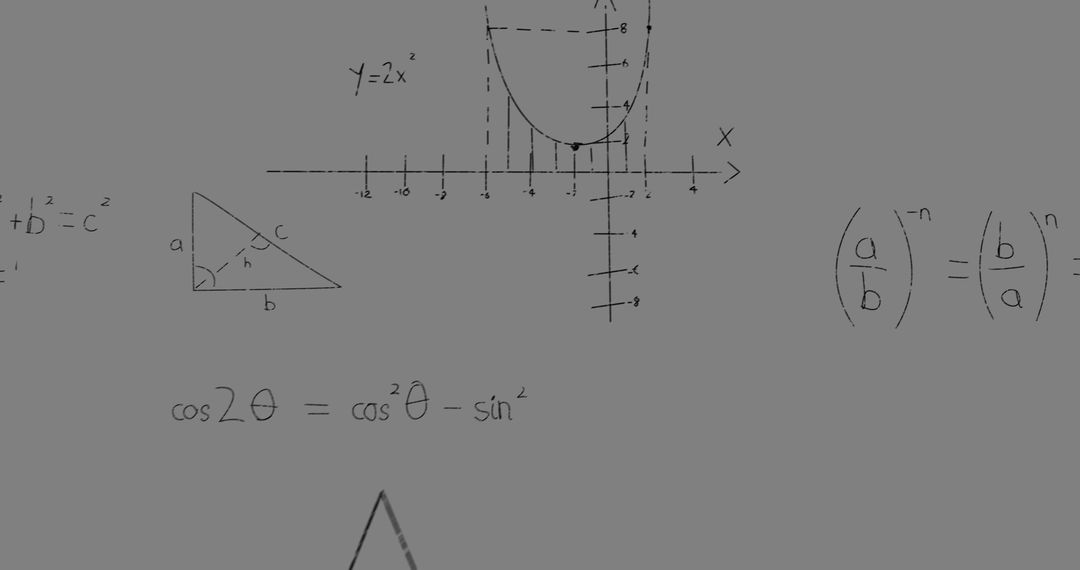
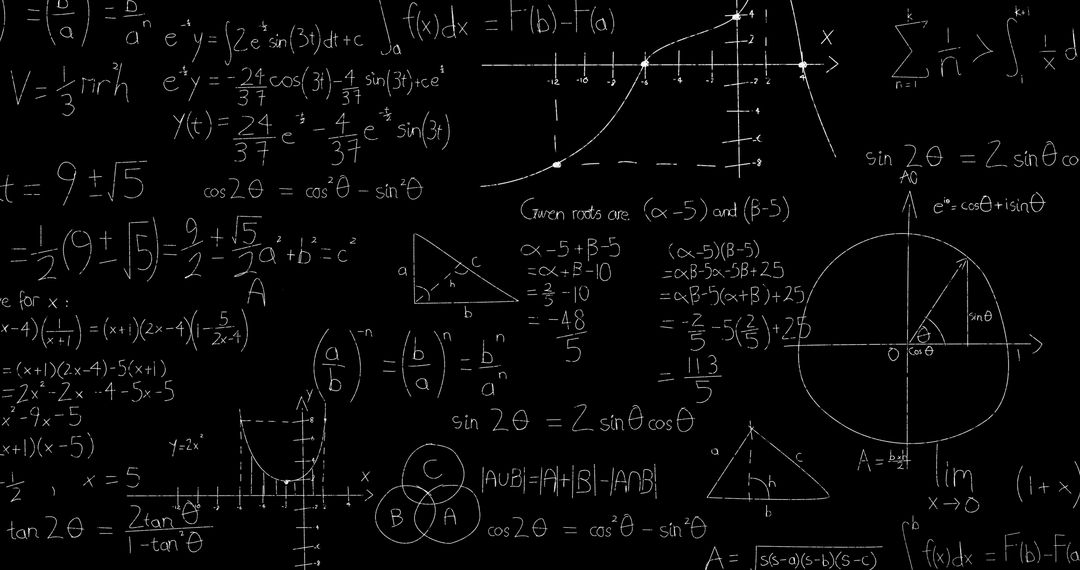
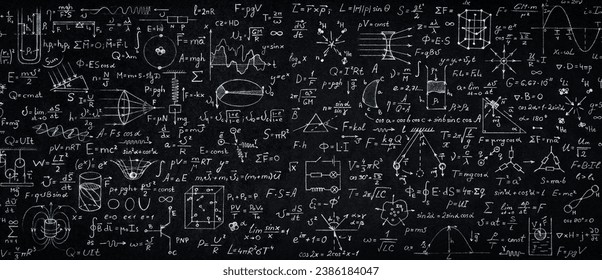
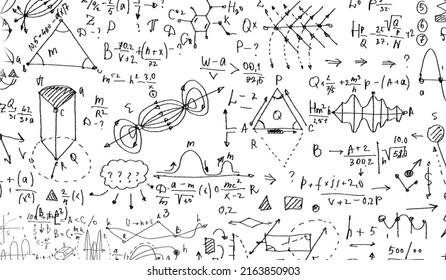
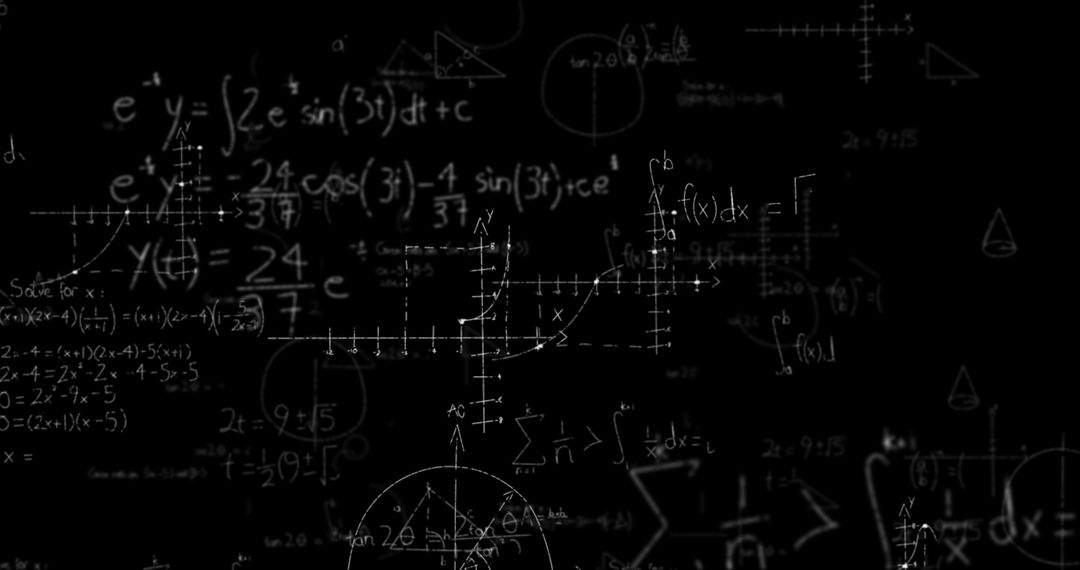
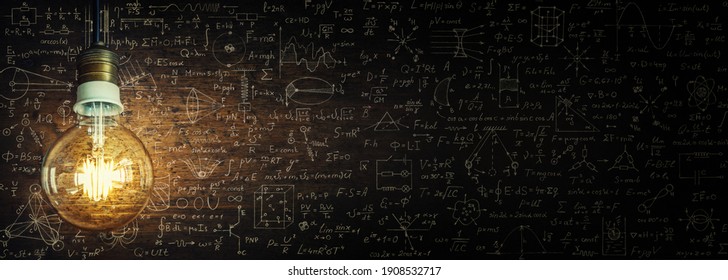
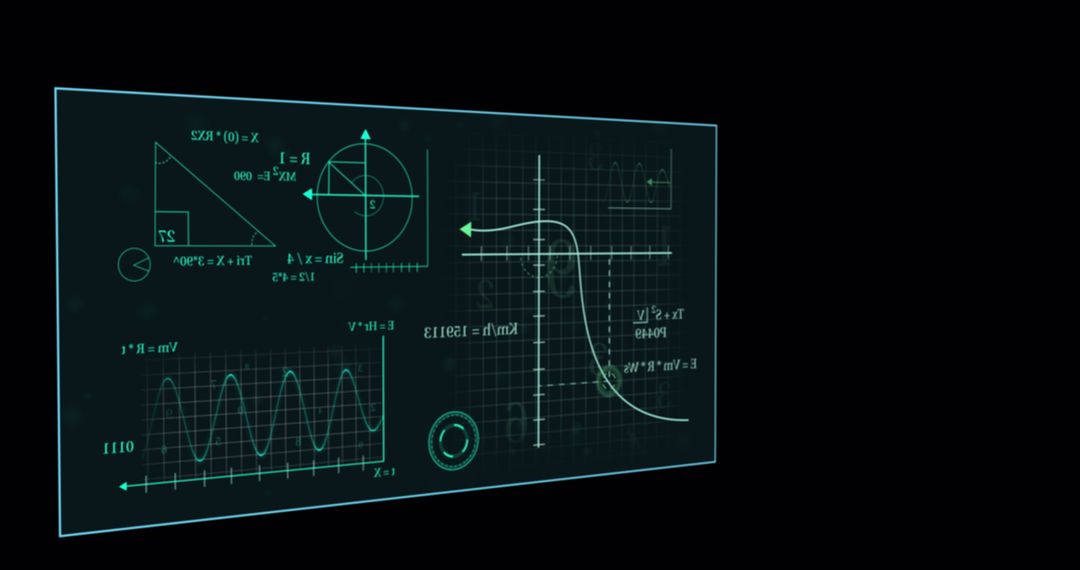
- Mathematical Equations and Graphs on Black Background
Mathematical Equations and Graphs on Black Background Image
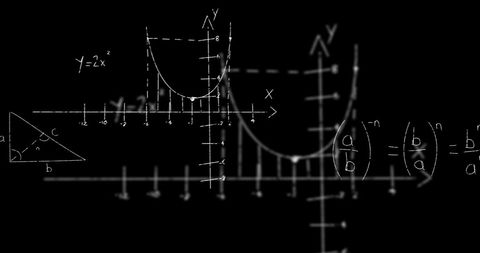
Illustration displays mathematical equations and graphs, symbolizing advanced educational themes. Useful in educational materials, websites and blogs discussing math or science, or technology-related presentations.
Powered by  - Get 15% off with code: PIKWIZARD15


2
downloads
downloads
Tags:
More
Credit Photo
If you would like to credit the Photo, here are some ways you can do so
Text Link
photo Link
<span class="text-link">
<span>
<a target="_blank" href=https://pikwizard.com/photo/mathematical-equations-and-graphs-on-black-background/dd93a6e88ee17a0e6a459ad0375df3da/>PikWizard</a>
</span>
</span>
<span class="image-link">
<span
style="margin: 0 0 20px 0; display: inline-block; vertical-align: middle; width: 100%;"
>
<a
target="_blank"
href="https://pikwizard.com/photo/mathematical-equations-and-graphs-on-black-background/dd93a6e88ee17a0e6a459ad0375df3da/"
style="text-decoration: none; font-size: 10px; margin: 0;"
>
<img src="https://pikwizard.com/pw/medium/dd93a6e88ee17a0e6a459ad0375df3da.jpg" style="margin: 0; width: 100%;" alt="" />
<p style="font-size: 12px; margin: 0;">PikWizard</p>
</a>
</span>
</span>
Free (free of charge)
Free for personal and commercial use.
Author: Awesome Content
Similar Free Stock Images
Premium


Premium


Premium


Premium


Premium


Premium


Premium

Premium


Premium


Premium


Premium


Premium


Premium
Premium


Premium


Premium


Premium


Premium


Premium


Premium


Premium


Premium


Premium


Premium