- Home >
- Stock Photos >
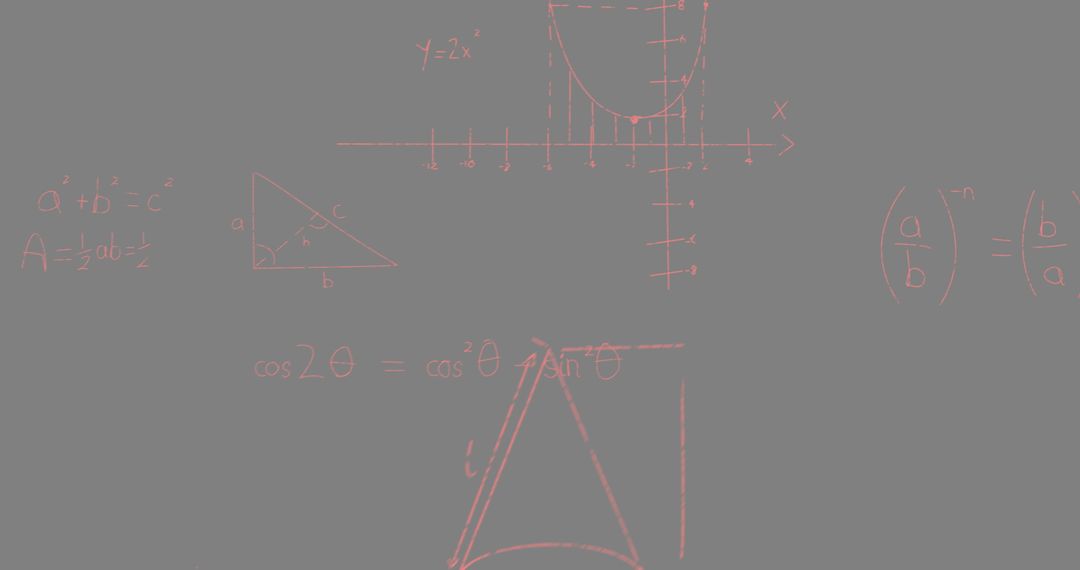
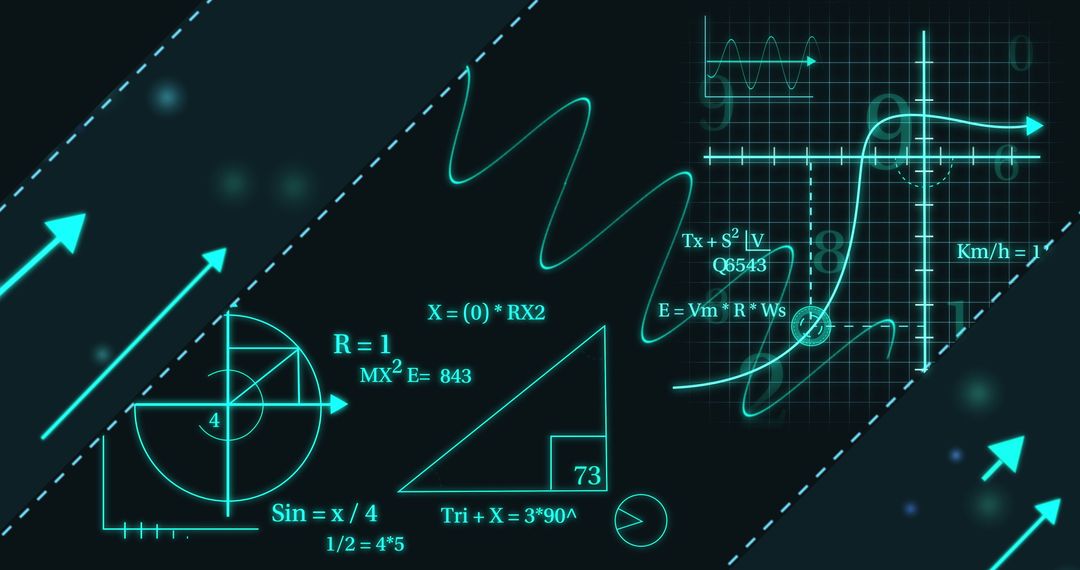
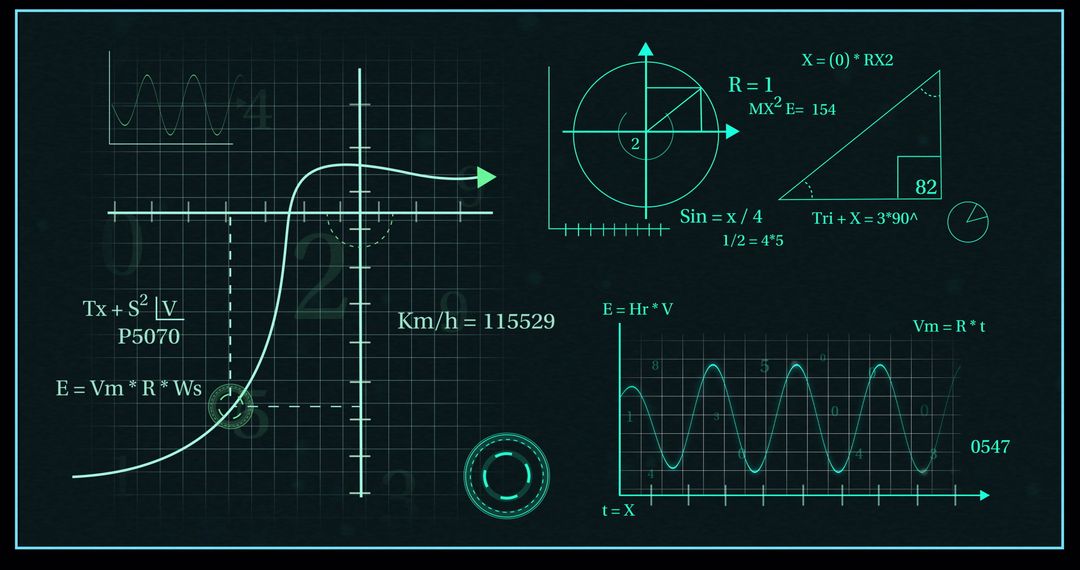
- Mathematical Equations with Graph and Illustrations on Whiteboard
Mathematical Equations with Graph and Illustrations on Whiteboard Image
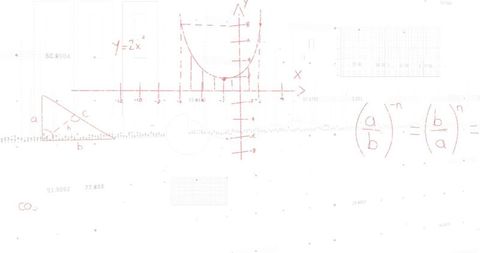
Illustration of mathematical concepts on whiteboard showing various elements including a parabola, right triangle, and algebraic equations, useful for educational content, study materials, academic presentations, or illustrative graphics in math textbooks.

0
downloads
downloads
Tags:
More
Credit Photo
If you would like to credit the Photo, here are some ways you can do so
Text Link
photo Link
<span class="text-link">
<span>
<a target="_blank" href=https://pikwizard.com/photo/mathematical-equations-with-graph-and-illustrations-on-whiteboard/a52fa6b80b30609e2a16abcdbf8ce4f6/>PikWizard</a>
</span>
</span>
<span class="image-link">
<span
style="margin: 0 0 20px 0; display: inline-block; vertical-align: middle; width: 100%;"
>
<a
target="_blank"
href="https://pikwizard.com/photo/mathematical-equations-with-graph-and-illustrations-on-whiteboard/a52fa6b80b30609e2a16abcdbf8ce4f6/"
style="text-decoration: none; font-size: 10px; margin: 0;"
>
<img src="https://pikwizard.com/pw/medium/a52fa6b80b30609e2a16abcdbf8ce4f6.jpg" style="margin: 0; width: 100%;" alt="" />
<p style="font-size: 12px; margin: 0;">PikWizard</p>
</a>
</span>
</span>
Free (free of charge)
Free for personal and commercial use.
Author: Awesome Content
Similar Free Stock Images