- Home >
- Stock Photos >
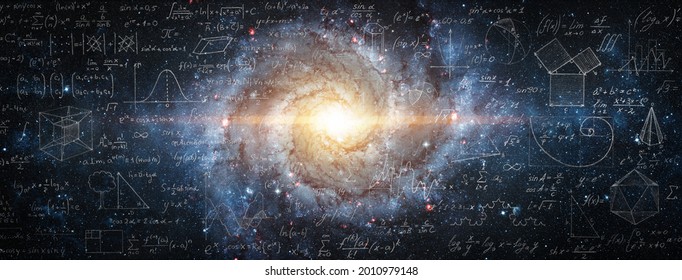
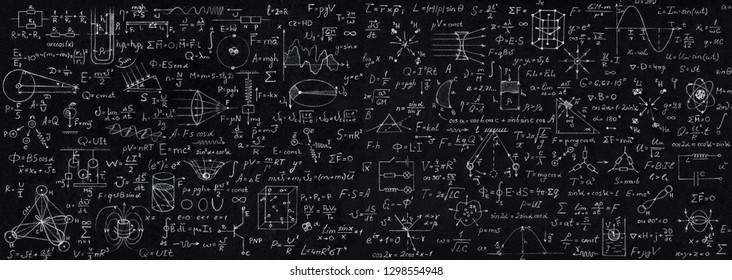
- Mathematical Formulas and Red Line Graph in Foggy Background
Mathematical Formulas and Red Line Graph in Foggy Background Image

Math-focused scene featuring equations and a red line graph overlay, ideal for educational materials, workshops, or lectures on algebra and calculus topics. Use for science-themed presentations and educational posters highlighting mathematical concepts and problem-solving.
Powered by  - Get 15% off with code: PIKWIZARD15


3
downloads
downloads
Tags:
More
Credit Photo
If you would like to credit the Photo, here are some ways you can do so
Text Link
photo Link
<span class="text-link">
<span>
<a target="_blank" href=https://pikwizard.com/photo/mathematical-formulas-and-red-line-graph-in-foggy-background/a6a09145cf385a093bd9360774f1a8ef/>PikWizard</a>
</span>
</span>
<span class="image-link">
<span
style="margin: 0 0 20px 0; display: inline-block; vertical-align: middle; width: 100%;"
>
<a
target="_blank"
href="https://pikwizard.com/photo/mathematical-formulas-and-red-line-graph-in-foggy-background/a6a09145cf385a093bd9360774f1a8ef/"
style="text-decoration: none; font-size: 10px; margin: 0;"
>
<img src="https://pikwizard.com/pw/medium/a6a09145cf385a093bd9360774f1a8ef.jpg" style="margin: 0; width: 100%;" alt="" />
<p style="font-size: 12px; margin: 0;">PikWizard</p>
</a>
</span>
</span>
Free (free of charge)
Free for personal and commercial use.
Author: Creative Art
Similar Free Stock Images

Premium


Premium


Premium


Premium


Premium


Premium


Premium


Premium


Premium


Premium


Premium


Premium


Premium


Premium


Premium


Premium


Premium


Premium


Premium


Premium


Premium


Premium


Premium


Premium