
- Home >
- Free Stock Photos & Images >
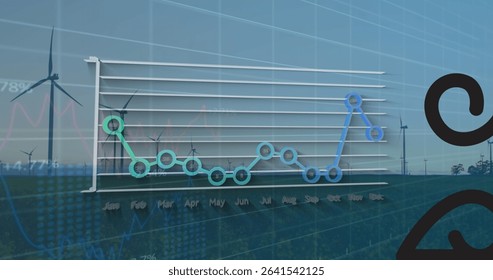
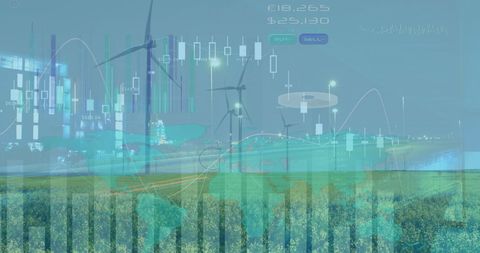
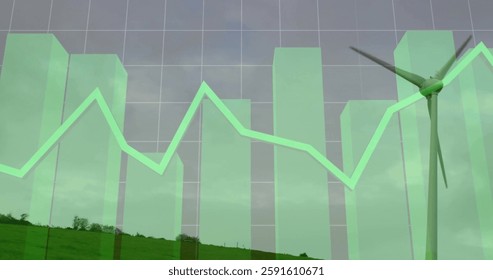
- Merging wind farm analytics with interactive data visualization and clean energy charts
Merging wind farm analytics with interactive data visualization and clean energy charts Free Stock Image

Merging wind turbines with layered charts, showing renewable energy production trends, financial metrics, and environmental data over grassy rural field. Working well for sustainability reports, investor presentations, corporate websites, energy startup pitch decks, research papers, and social media campaigns. Supporting customization such as adding company logo, overlaying live KPI numbers, applying color grading to match brand, and converting into hero banner or infographic background. Featuring cool blue and green palette, modern translucent graphs, spacious composition for headline and data callouts, and high contrast elements for readable overlays. Helping communicate energy transition concepts, clean technology performance, and data-driven sustainability storytelling.
Powered by  - Get 15% off with code: PIKWIZARD15


downloads
Tags:
More
Credit Photo
If you would like to credit the Photo, here are some ways you can do so
Text Link
photo Link
<span class="text-link">
<span>
<a target="_blank" href=https://pikwizard.com/photo/merging-wind-farm-analytics-with-interactive-data-visualization-and-clean-energy-charts/7710b336c23e7a825e11d56ebabb96ca/>PikWizard</a>
</span>
</span>
<span class="image-link">
<span
style="margin: 0 0 20px 0; display: inline-block; vertical-align: middle; width: 100%;"
>
<a
target="_blank"
href="https://pikwizard.com/photo/merging-wind-farm-analytics-with-interactive-data-visualization-and-clean-energy-charts/7710b336c23e7a825e11d56ebabb96ca/"
style="text-decoration: none; font-size: 10px; margin: 0;"
>
<img src="https://thumbs.wbm.im/pw/medium/7710b336c23e7a825e11d56ebabb96ca.jpg" style="margin: 0; width: 100%;" alt="Merging wind farm analytics with interactive data visualization and clean energy charts" />
<p style="font-size: 12px; margin: 0;">PikWizard</p>
</a>
</span>
</span>
Free (free of charge)
Free for personal and commercial use.
Author: People Creations
Similar Free Stock Images


Premium


Premium


Premium


Premium


Premium


Premium


Premium


Premium


Premium


Premium


Premium


Premium


Premium


Premium


Premium


Premium


Premium


Premium


Premium


Premium


Premium


Premium


Premium


Premium


Premium

Explore More Free Stock Images