
- Home >
- Stock Photos >
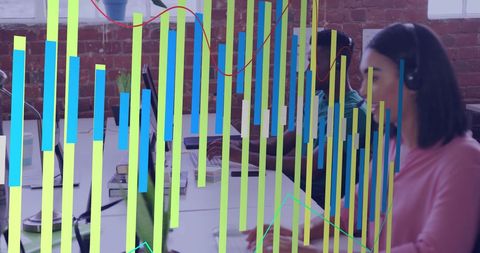
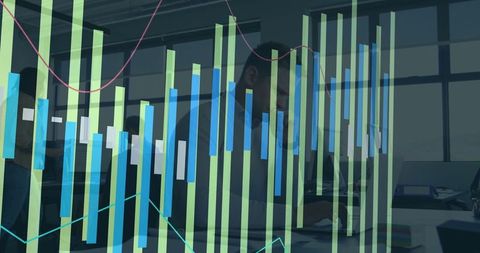
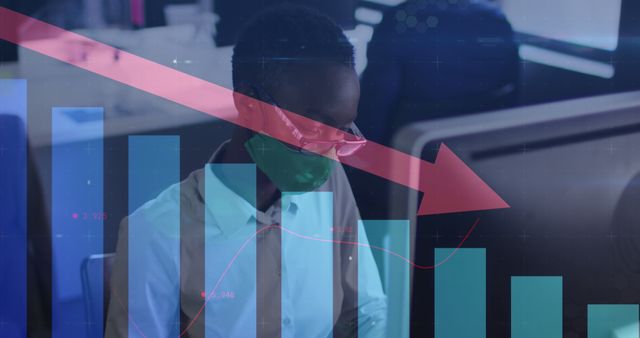
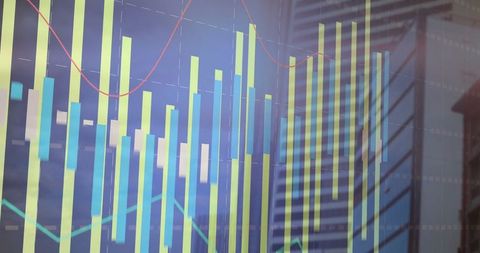
- Mid-Adult Man Analyzing Financial Bar Charts and Trend Lines Overlaying Cafe Workspace
Mid-Adult Man Analyzing Financial Bar Charts and Trend Lines Overlaying Cafe Workspace Image
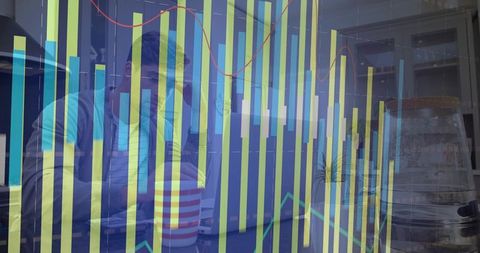
Showing mid-adult man in casual jacket leaning at cafe table, working on laptop with striped mug and shelving visible. Bright vertical bar chart and red trend line overlaying glass reflection, creating layered financial analytics concept. Ideal for illustrating data-driven decision making, market analysis, remote work, fintech marketing, startup pitch decks, financial reports, business blogs, social media campaigns. Use as website hero banner, presentation slide background, report cover, blog header, advertisement for data visualization tools, or training material for analytics workshops. Colorful overlays and reflective composition providing modern, dynamic look suitable for corporate and creative projects.
Powered by 


downloads
Tags:
More
Credit Photo
If you would like to credit the Photo, here are some ways you can do so
Text Link
photo Link
<span class="text-link">
<span>
<a target="_blank" href=https://pikwizard.com/photo/mid-adult-man-analyzing-financial-bar-charts-and-trend-lines-overlaying-cafe-workspace/4a2a4af94cf3342cd98b850f8c663f40/>PikWizard</a>
</span>
</span>
<span class="image-link">
<span
style="margin: 0 0 20px 0; display: inline-block; vertical-align: middle; width: 100%;"
>
<a
target="_blank"
href="https://pikwizard.com/photo/mid-adult-man-analyzing-financial-bar-charts-and-trend-lines-overlaying-cafe-workspace/4a2a4af94cf3342cd98b850f8c663f40/"
style="text-decoration: none; font-size: 10px; margin: 0;"
>
<img src="https://pikwizard.com/pw/medium/4a2a4af94cf3342cd98b850f8c663f40.jpg" style="margin: 0; width: 100%;" alt="" />
<p style="font-size: 12px; margin: 0;">PikWizard</p>
</a>
</span>
</span>
Free (free of charge)
Free for personal and commercial use.
Author: Awesome Content
Similar Free Stock Images
Loading...

Premium


Premium


Premium


Premium


Premium
Premium

Premium


Premium

Premium


Premium

Premium

Premium


Premium


Premium


Premium


Premium

Premium


Premium


Premium


Premium


Premium


Premium


Premium


Premium


Premium


Explore More Free Stock Images