- Home >
- Stock Photos >
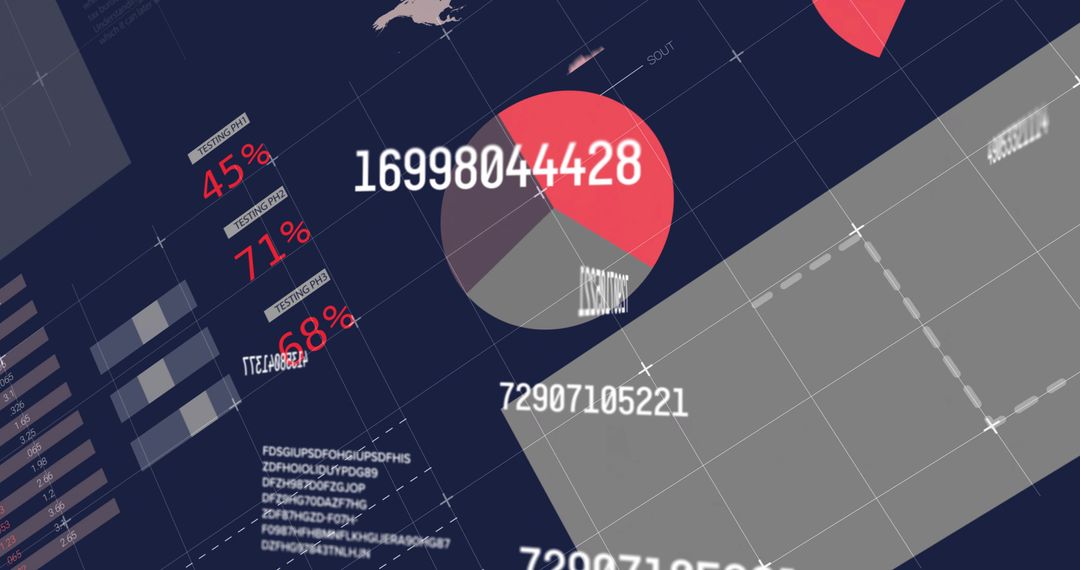
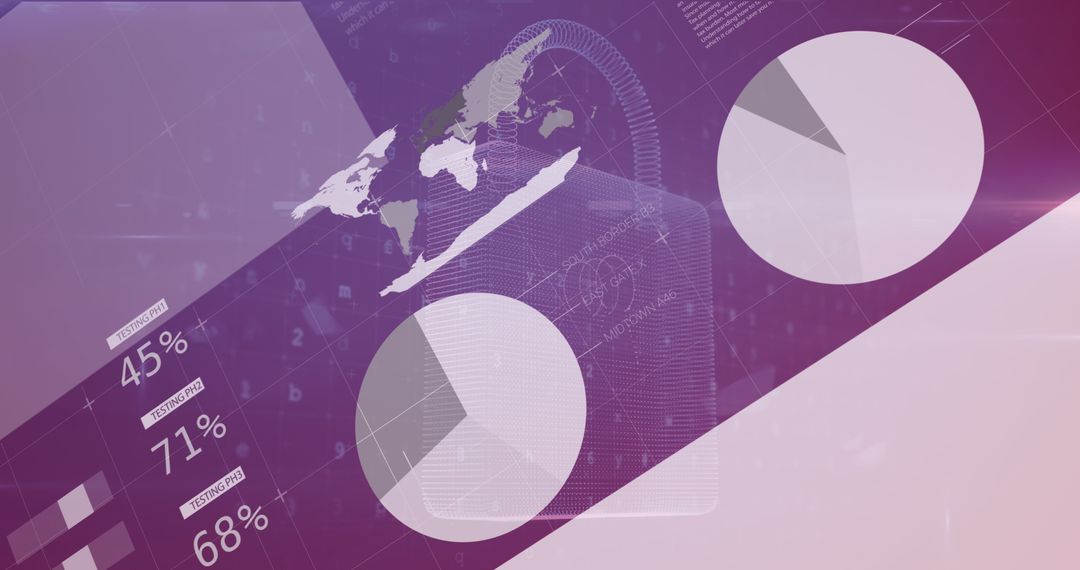
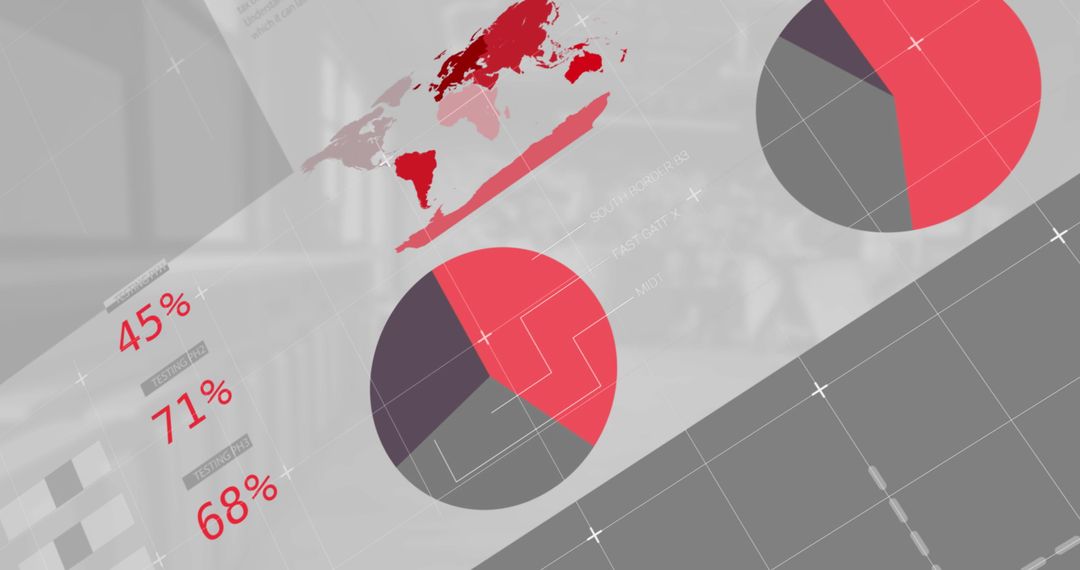
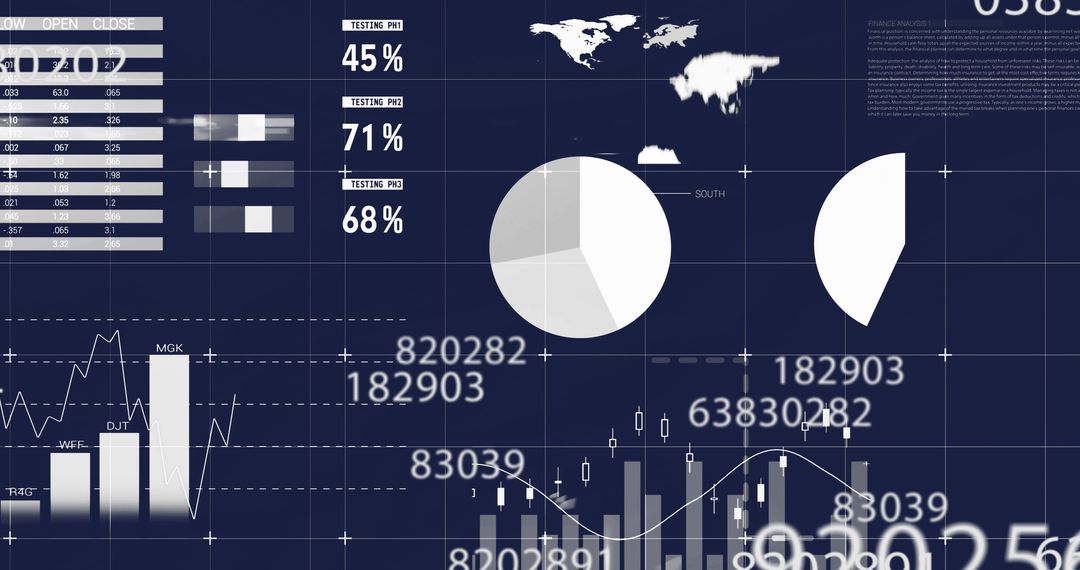
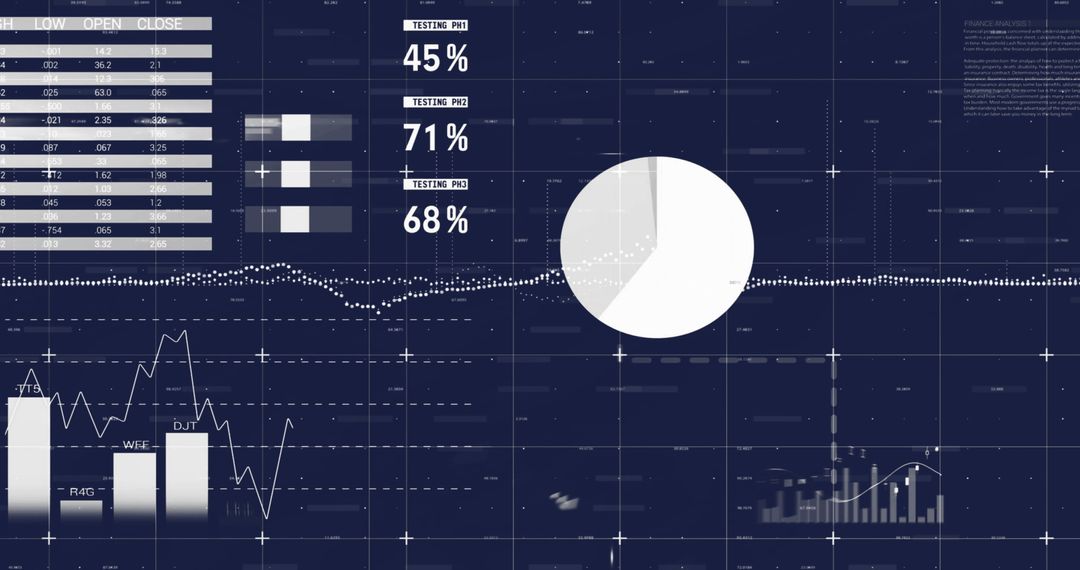
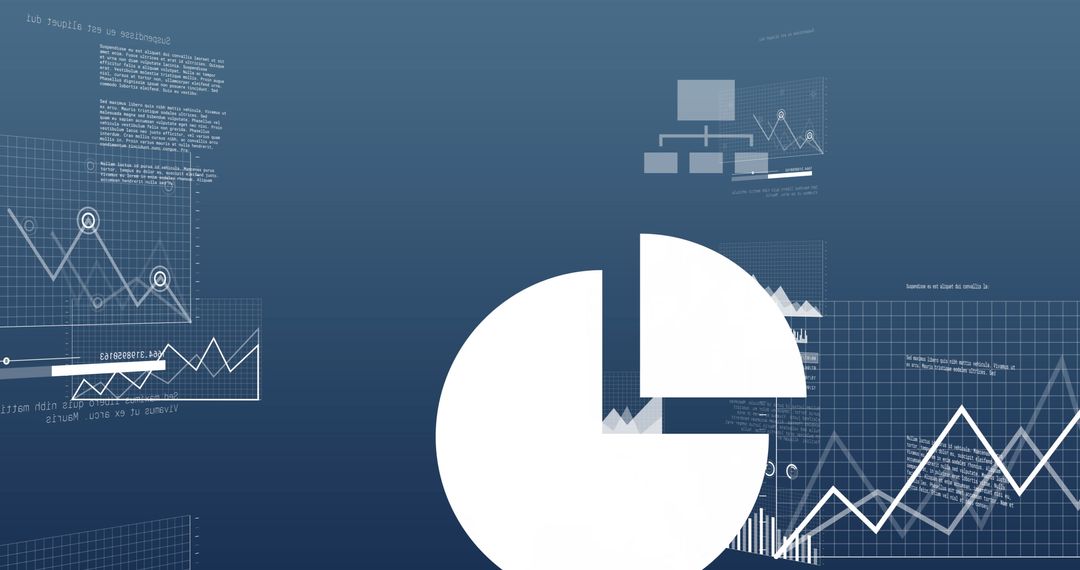
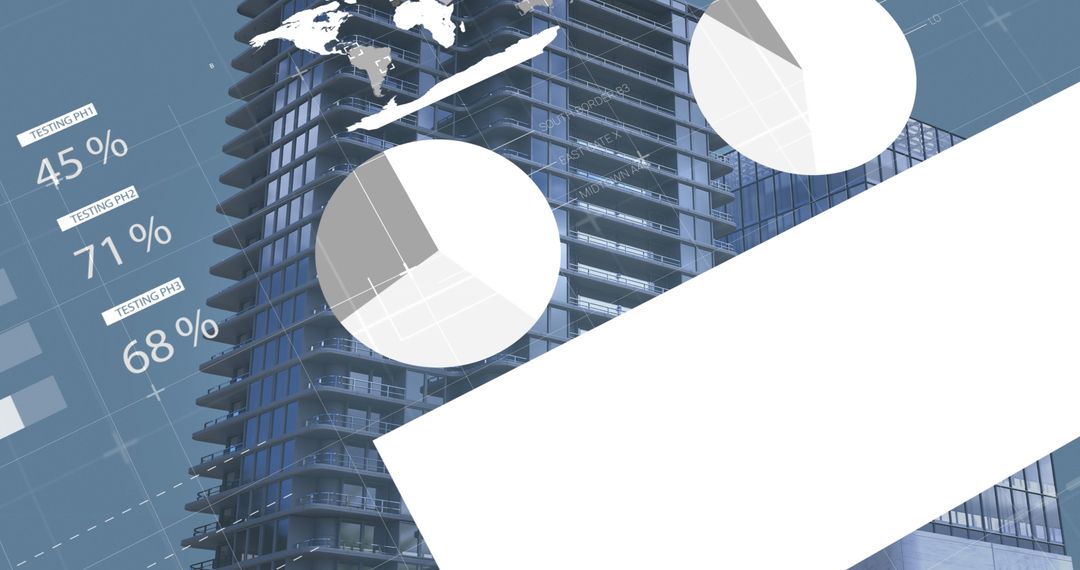
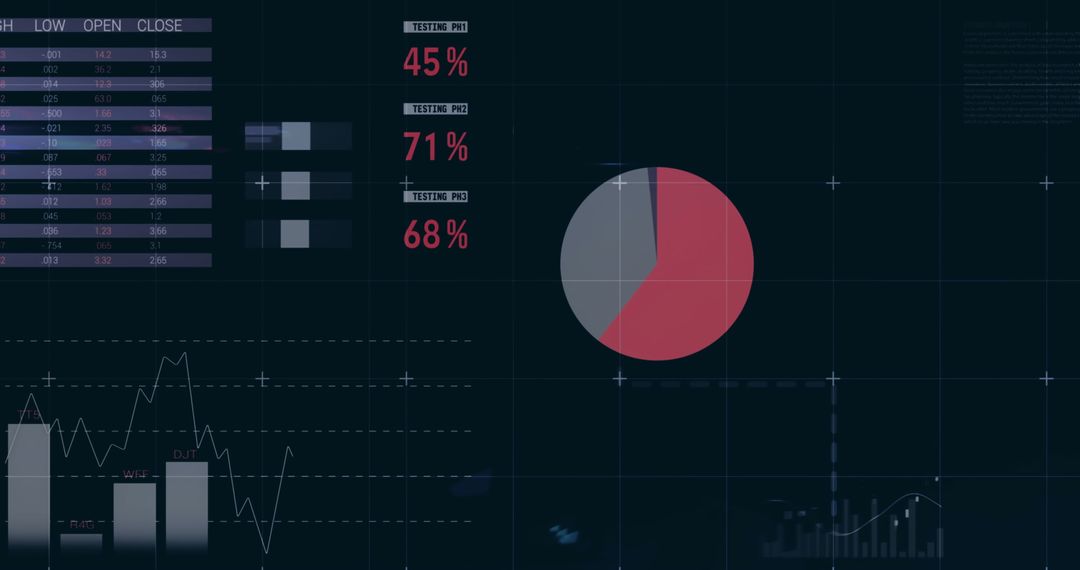
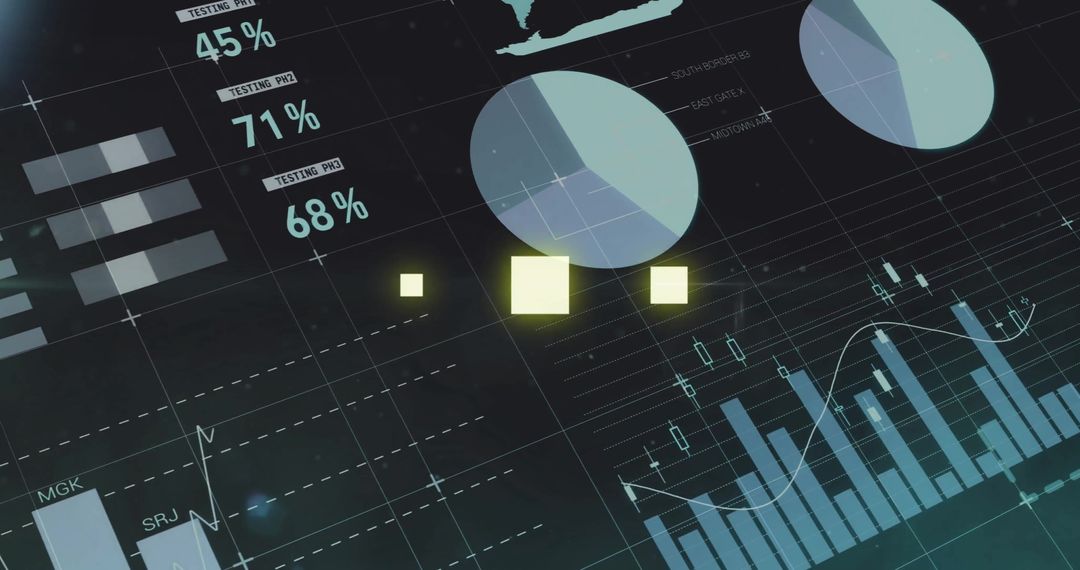
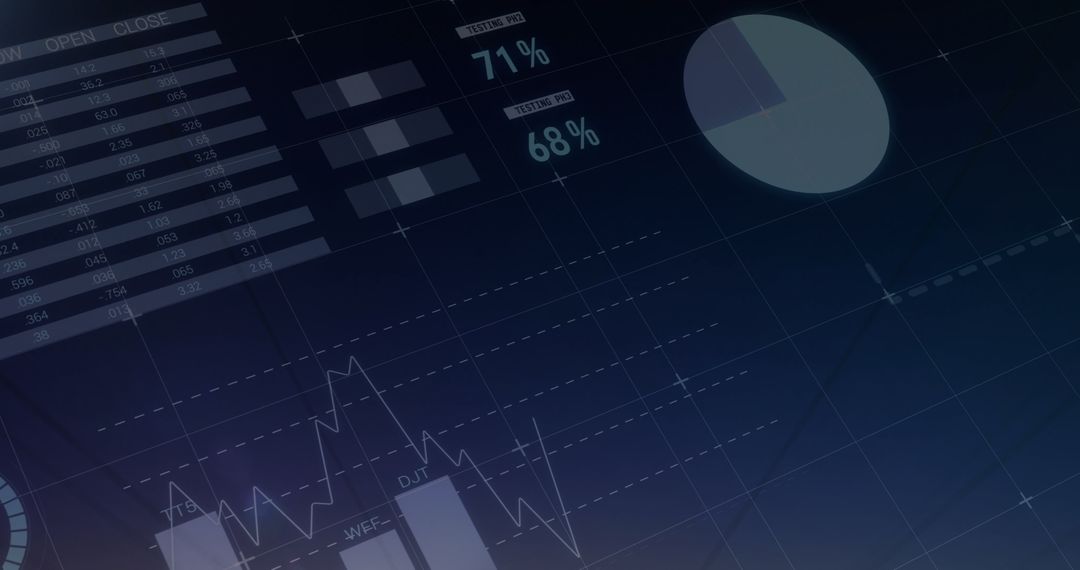
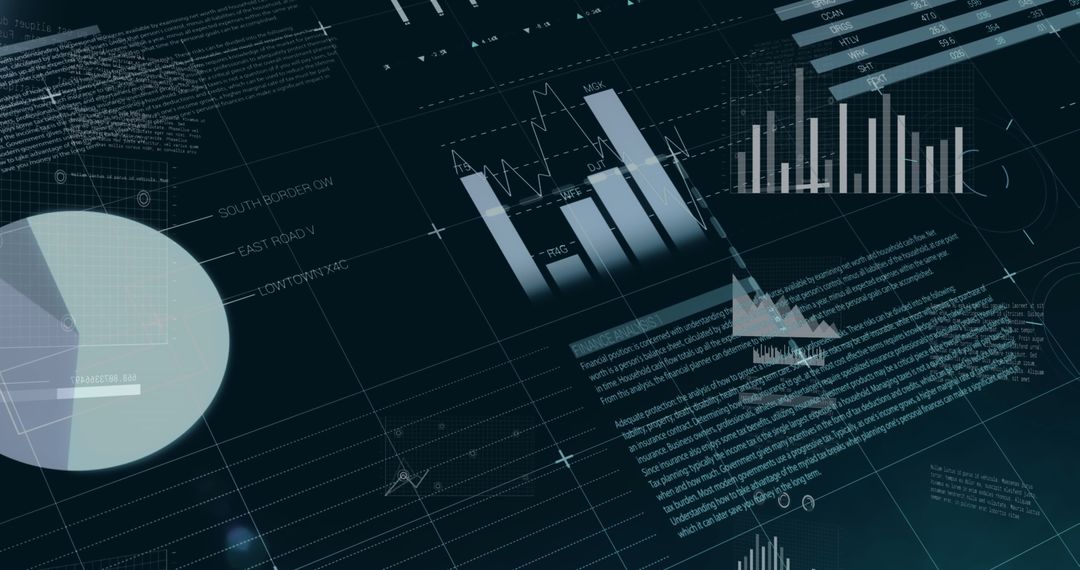
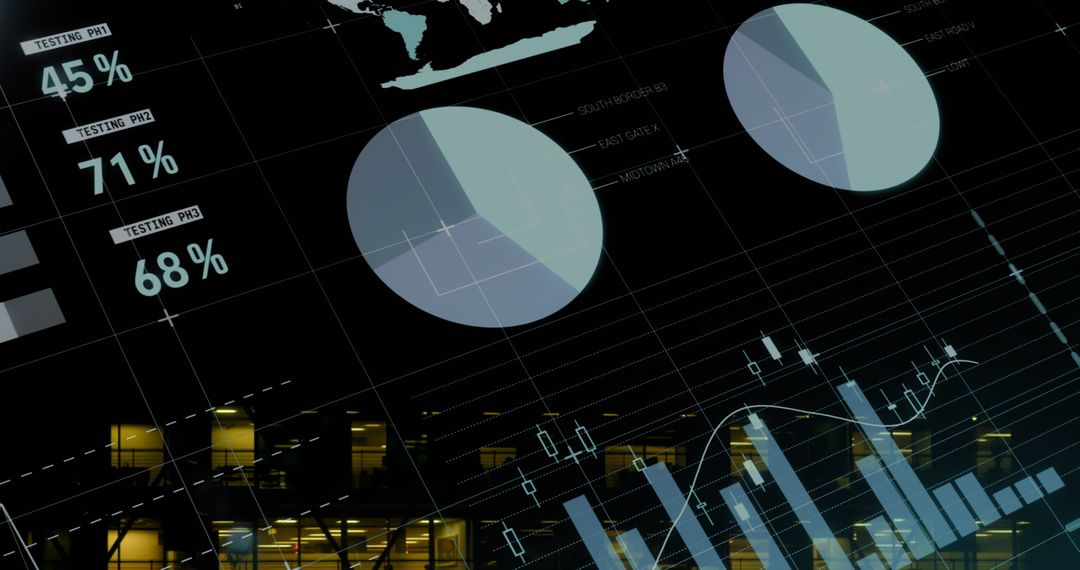
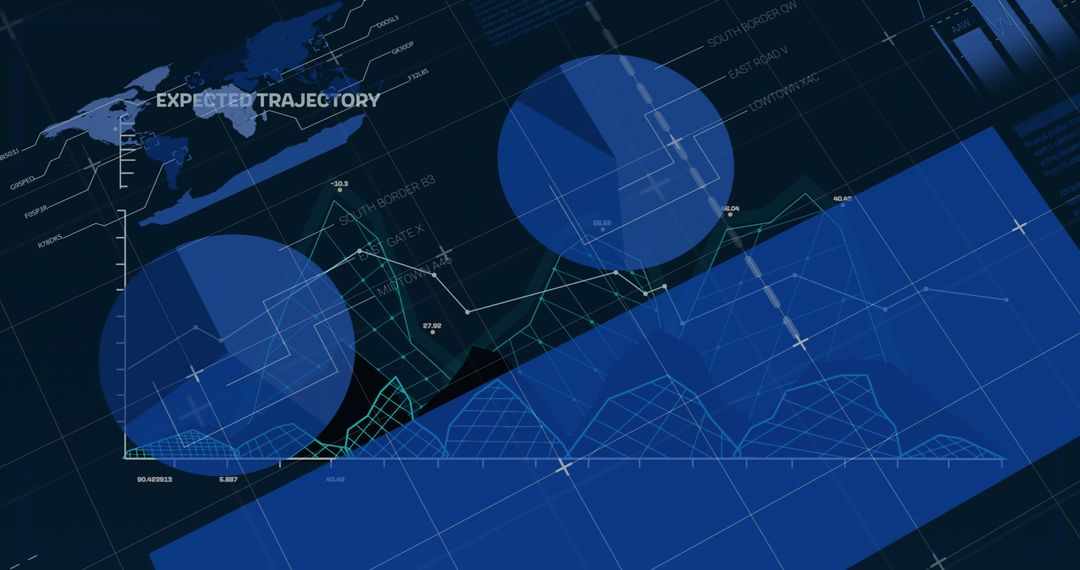
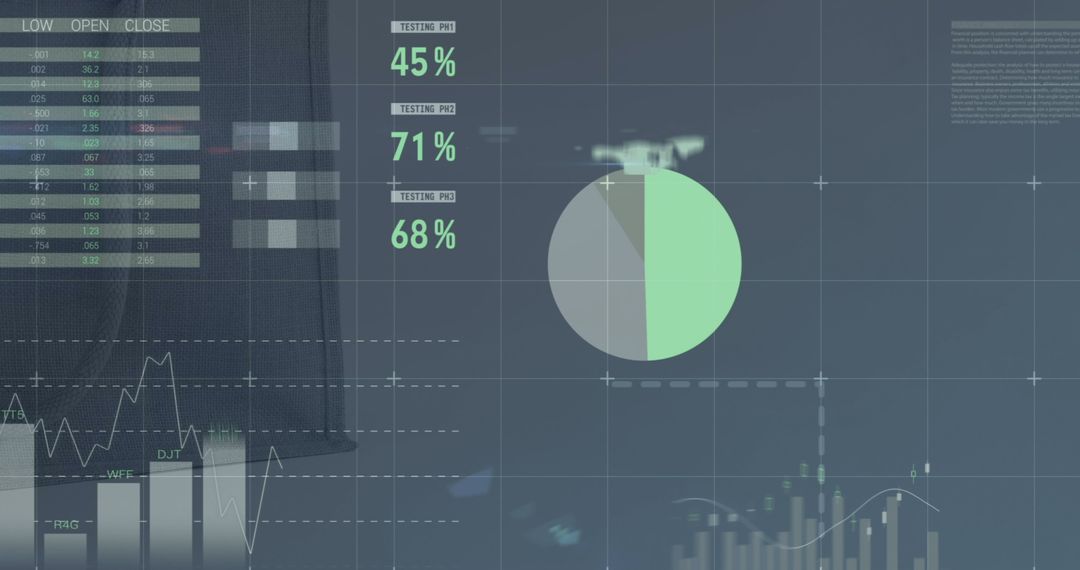
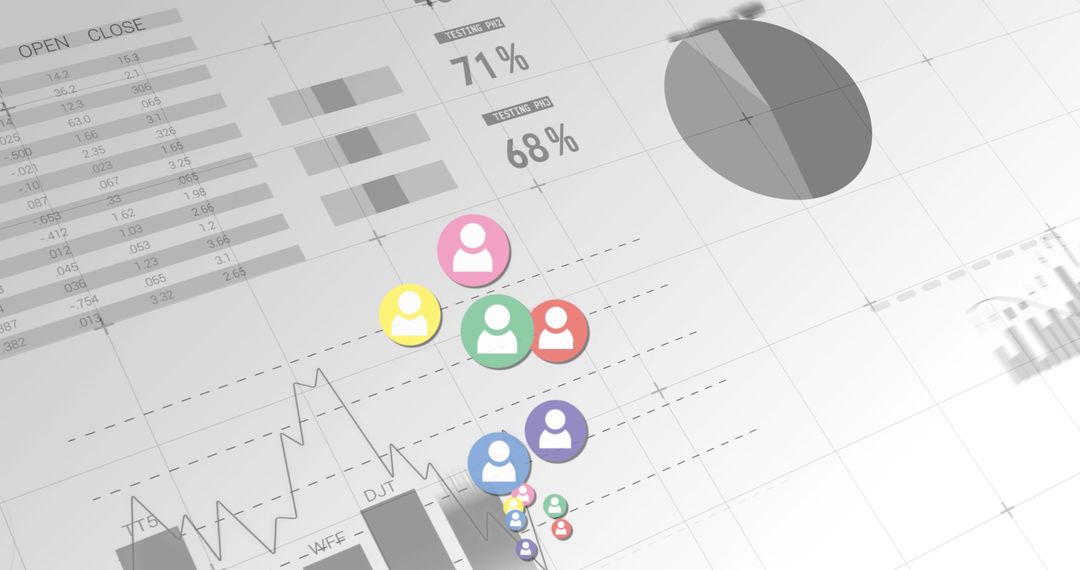
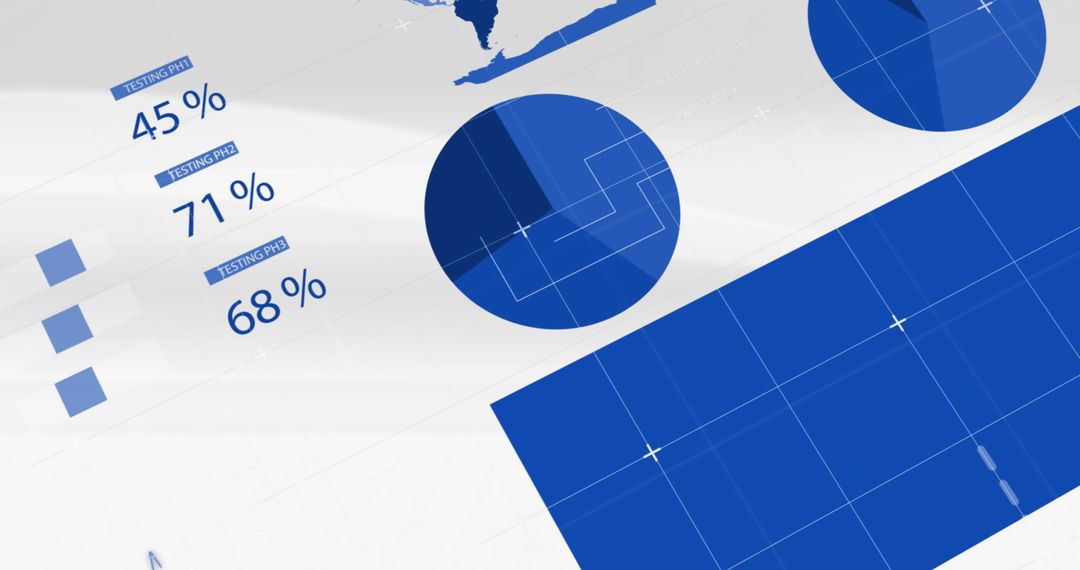
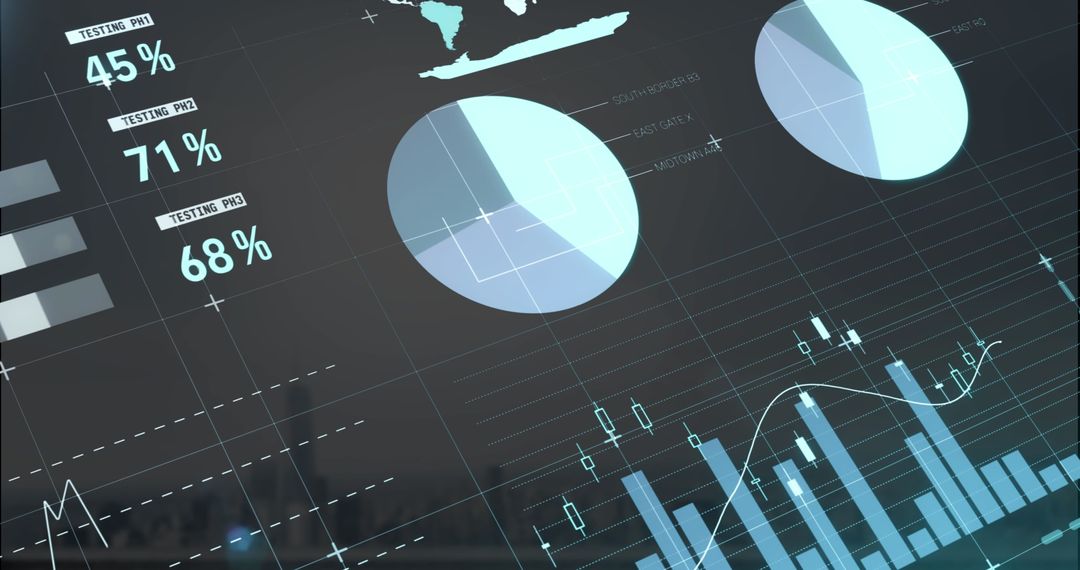
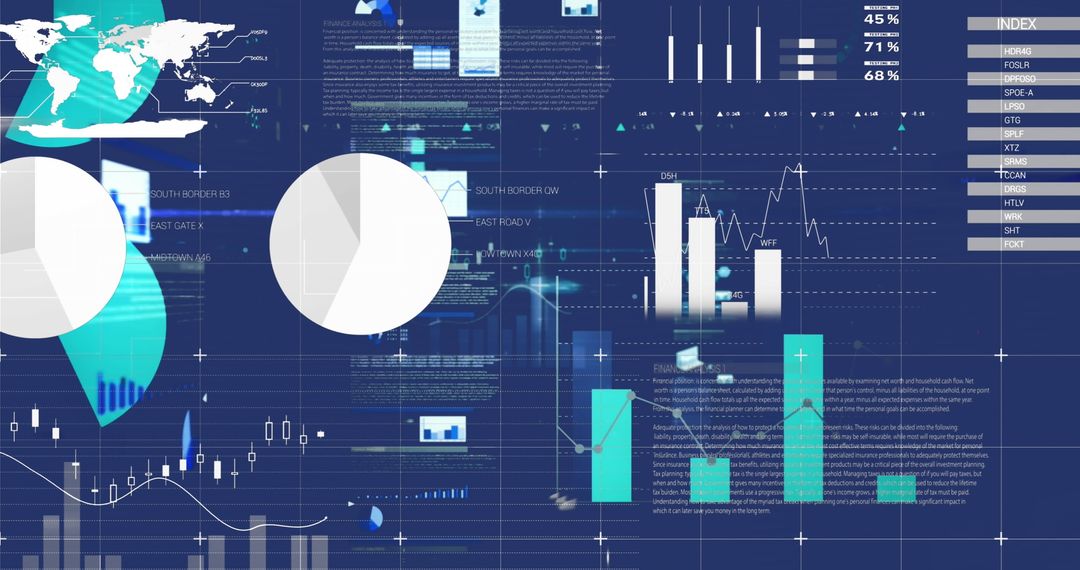
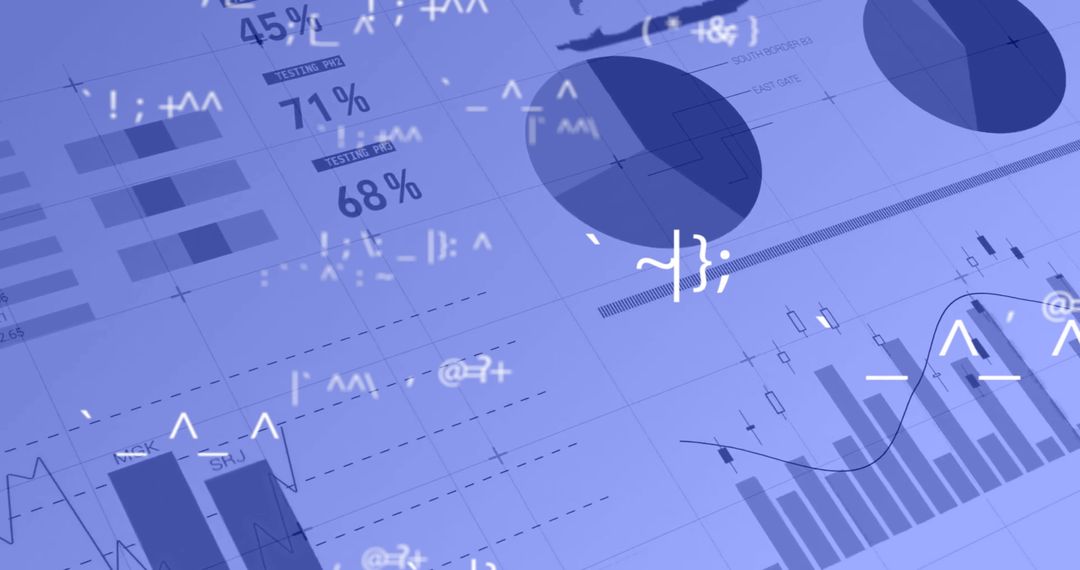
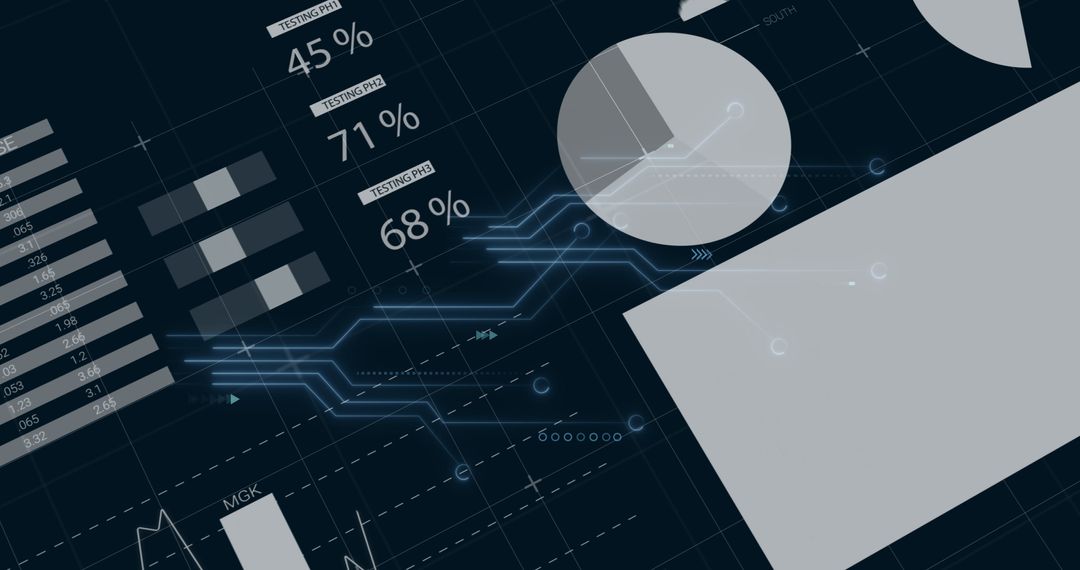
- Minimalist Data Dashboard Displaying Monochrome Infographic, Pie Chart, Percent Metrics
Minimalist Data Dashboard Displaying Monochrome Infographic, Pie Chart, Percent Metrics Image
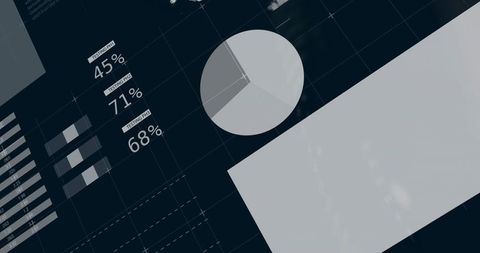
Dark navy grid layout showing pie chart, stacked bars and percent metrics (45%, 71%, 68%) with diagonal panel creating modern minimalist composition. Monochrome palette keeping focus on data and layout, allowing easy brand color overlay and typographic emphasis. Use for presentation slides, website hero banners, annual reports, dashboard mockups, UX prototypes, business reports and marketing materials. Cropping for header graphics, adding headline text over diagonal panel, animating segments for digital presentations, overlaying icons to illustrate categories. High contrast and clean geometry working well for corporate themes and tech presentations. Horizontal crop with ample negative space for copy and logo placement. Ideal for print and digital, editable in common design software.
Powered by 


0
downloads
downloads
Tags:
More
Credit Photo
If you would like to credit the Photo, here are some ways you can do so
Text Link
photo Link
<span class="text-link">
<span>
<a target="_blank" href=https://pikwizard.com/photo/minimalist-data-dashboard-displaying-monochrome-infographic-pie-chart-percent-metrics/511549eaedd763b3d5a69f0453e8633f/>PikWizard</a>
</span>
</span>
<span class="image-link">
<span
style="margin: 0 0 20px 0; display: inline-block; vertical-align: middle; width: 100%;"
>
<a
target="_blank"
href="https://pikwizard.com/photo/minimalist-data-dashboard-displaying-monochrome-infographic-pie-chart-percent-metrics/511549eaedd763b3d5a69f0453e8633f/"
style="text-decoration: none; font-size: 10px; margin: 0;"
>
<img src="https://pikwizard.com/pw/medium/511549eaedd763b3d5a69f0453e8633f.jpg" style="margin: 0; width: 100%;" alt="" />
<p style="font-size: 12px; margin: 0;">PikWizard</p>
</a>
</span>
</span>
Free (free of charge)
Free for personal and commercial use.
Author: Awesome Content
Similar Free Stock Images

Premium


Premium


Premium


Premium

Premium


Premium


Premium


Premium

Premium


Premium


Premium


Premium


Premium


Premium


Premium


Premium


Premium


Premium


Premium

Premium


Premium


Premium


Premium


Premium